I.INTRODUCTION
Visually impaired individuals face critical challenges in perceiving and interacting with their environment, creating an urgent need for real-time, accurate assistive technologies that support daily independence and safety. Traditional assistive technologies, such as text-based screen readers and tactile indicators, have limitations in providing real-time spatial awareness. The latest developments in artificial intelligence, machine learning, big data processing, Internet of Things, mobile computing, as well as their integration in terms of services, have empowered many research domains from theoretical exploration into practical applications[1,2]. My Eye AI addresses these challenges by employing vision image processing and natural language processing to deliver a seamless detection and scene description experience. Several applications have been deployed to aid visually impaired individuals using modern technology. However, the existing solutions exhibit certain limitations. For example, Google Lookout offers object detection, text reading, scene exploration, and currency identification, but it is limited to Android users [3]. Microsoft’s Seeing AI supports text recognition, facial recognition, and barcode scanning, but lacks real-time scene description, a crucial feature for navigation [4]. Meanwhile, Envision AI integrates object recognition, text reading, and navigation assistance, but requires expensive, specialized smart glasses priced at ($1900+), creating a financial barrier for many users [5].
My Eye AI addresses these gaps by offering a cost-effective, cross-platform (Android and iOS) solution that integrates real-time scene description and object detection via voice commands without additional hardware, and it uses the user’s personal phone only. By utilizing Bootstrapping Language-Image Pretraining (BLIP) for the scene Description [6], custom-trained YOLOv11 [7,8] X-Large variant, and OWL-ViT [9] for object detection, My Eye AI ensures high accuracy in recognizing objects commonly used in our daily lives. Furthermore, the model is hosted in the cloud, enabling compatibility even with older smartphones.
My Eye AI is designed to be cost-effective, cross-platform, and hardware-agnostic by offloading heavy inference to a cloud Application Programming Interface (API) while keeping the client lightweight. This enables consistent capability on both Android and iOS without specialized wearables, preserving updatability and scalability.
This paper builds on a conference paper published in ISADS 2025 [10], which presented the initial design, implementation, and analysis of My Eye AI. This journal version extends the prior work by introducing a hybrid cloud-mobile implementation, conducting extensive experiments, and providing a detailed performance analysis, significantly enhancing both practical deployability and scientific rigor compared to the original prototype. The system is designed to assist visually impaired users through object detection, open-vocabulary recognition, and natural-language scene description.
Formally, the system maps an input image III to detected objects O, open-vocabulary labels L, and natural-language scene descriptions S:
where YOLOv11 performs object detection, OWL-ViT provides zero-shot label recognition, and BLIP generates contextual scene descriptions.The sequential processing can also be expressed as
This model clarifies how the system converts visual input into meaningful semantic descriptions for real-time scene understanding.
This journal version enhances the original prototype by retraining YOLOv11 (X-Large) on a rebalanced dataset, integrating OWL-ViT for zero-shot detection, and incorporating BLIP for contextual scene understanding. The enhanced system addresses prior challenges of dataset imbalance, overfitting, and limited vocabulary coverage, achieving measurable improvements: mAP@0.5 increased from 0.443 to 0.578, recall from 0.457 to 0.603, while latency remained under 1.3 s. These results demonstrate a deployable, efficient, and accurate assistive system, providing practical daily support for visually impaired users and advancing machine vision using state-of-the-art algorithms.
The rest of the paper is structured as follows. Section II presents related work. Section III introduces the system architecture and the methodology applied in this study. Section IV analyzes the experiment results. Section V further discusses the impacts and innovations. Section VI concludes the paper.
II.RELATED WORK
Assistive technologies for the visually impaired have seen rapid development, especially with the integration of artificial intelligence for object detection, navigation assistance, and environmental awareness. Despite these advances, many existing systems continue to face challenges related to adaptability, affordability, real-time responsiveness, and limited vocabulary flexibility.
Commercial applications such as Google Lookout [3] and Microsoft’s Seeing AI [4] provide valuable features such as object detection, OCR, and barcode recognition. However, Lookout remains restricted to Android devices, while Seeing AI lacks real-time scene understanding. Envision AI [5] offers broader functionality but requires expensive smart glasses, limiting accessibility for many users.
In academic research, Kumar et al. [12] implemented a YOLOv3-based mobile solution for object recognition with voice feedback, constrained by a fixed COCO dataset vocabulary. Du et al. [13] developed an intelligent wheelchair for blind spot obstacle detection using inexpensive cameras. The study used an improved YOLOV5 lightweight obstacle detection model and constructed an obstacle dataset consisting of incomplete target images captured in the smart wheelchair’s blind spot view. This approach requires the use of an additional camera and computing device installed on the wheelchair.
Shimakawa et al. [18] and Ranganayaki et al. [19] explored smartphone-based obstacle detection systems that combine object recognition with audio feedback. While Shimakawa’s system estimated distances using device orientation, Ranganayaki’s approach employed YOLOv8 and text-to-speech (TTS) to assist with obstacle avoidance. However, both systems remain limited to fixed vocabularies and do not support open-vocabulary recognition or natural language interaction.
Environment-focused approaches have also emerged. Chen et al. [14,15] proposed robotic platforms with mobile cameras to assist visually impaired individuals in navigating dynamic surroundings. Mashhadi et al. [16] introduced GeoNotify, which uses federated learning and crowd-sourced images to detect temporary obstacles. These methods promote community-driven safety but lack on-device inference and support for spontaneous user queries.
Wearable aids continue to be explored, though they often rely on basic sensors. Hersh [17] found that many such tools provide binary feedback using ultrasound or infrared, offering minimal semantic understanding. Ahmetovic [20] addressed macro and micro navigation using traditional machine learning and sensor fusion but faced scalability issues due to its reliance on manually crafted features.
Tharuka et al. introduced PathFinder [21], which is a Convolutional Neural Network (CNN)-based mobile app with integrated GPS and audio guidance that supports indoor and outdoor navigation. However, it is optimized for high-end devices and lacks support for multimodal interaction or dynamic vocabulary updates.
To overcome these limitations, our previous work presented at ISADS 2025 [10] introduced My Eye AI, a mobile-cloud hybrid system designed to deliver real-time object detection and scene description through a user’s personal smartphone. In this extended journal version, we expand upon that foundation by integrating OWL-ViT for open-vocabulary detection, refining the training dataset, enhancing performance evaluation, and introducing new deployment optimizations. By addressing the key shortcomings of prior systems, *My Eye AI* advances the field with a scalable, cost-effective, and adaptive solution for real-world assistive use.
III.SYSTEM ARCHITECTURE AND METHODOLOGY
A.SYSTEM DESIGN AND WORKFLOW
My Eye AI is implemented as a hybrid mobile-cloud artificial intelligence system, structured to optimize responsiveness, cross-platform accessibility, and model scalability. Fig. 1 shows the layered architecture of My Eye AI.
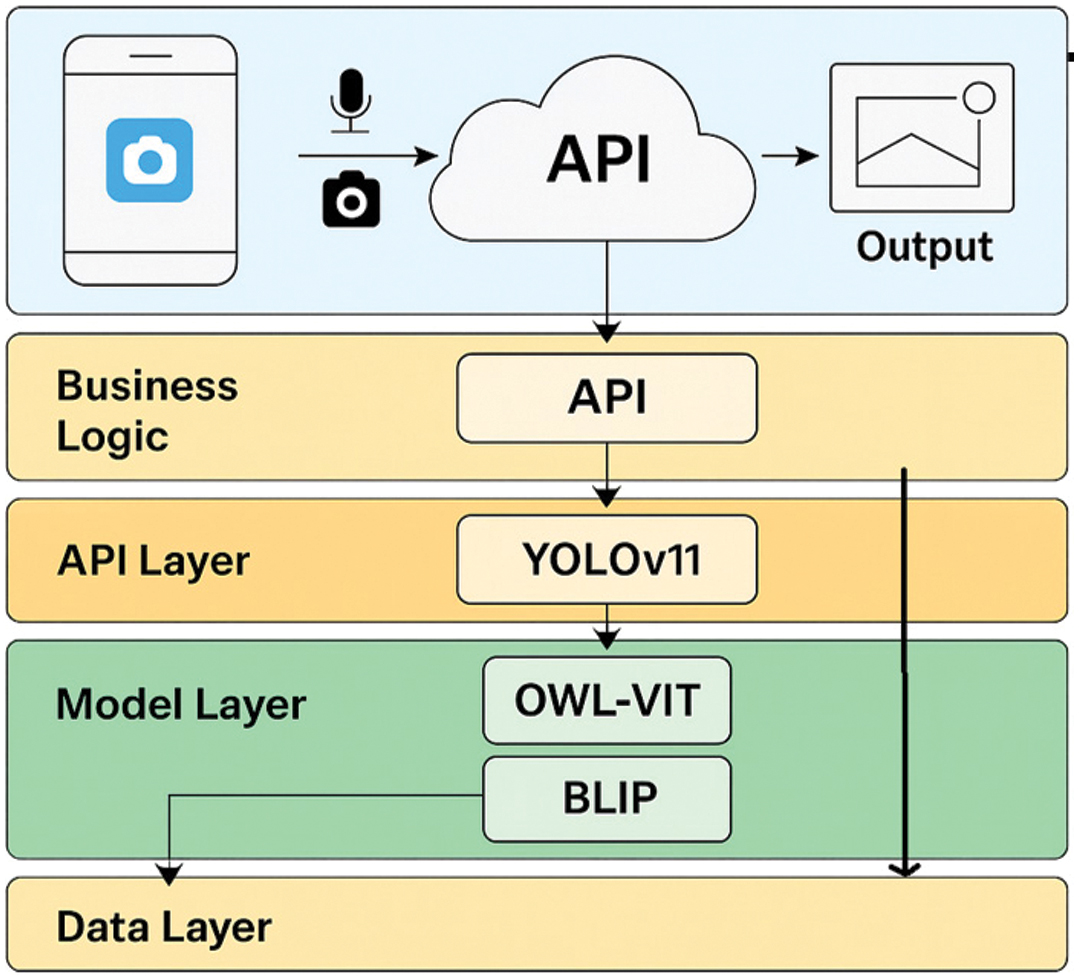 Fig. 1. Layered mobile–cloud architecture of My Eye AI.
The mobile app captures voice and camera input, and the cloud API routes input to the detection and description modules. YOLOv11 module detects the known objects, while the OWL-ViT module handles open-vocabulary queries. The BLIP module generates natural language scene captions, and the output module combines data and returned them to user in real time.
To promote maintainability and clear modularization, the application architecture follows a layered pattern composed of four key tiers [22] the presentation interface, business logic, state management, and cloud-based service backend.
At the forefront is the user interface, which is responsible for capturing input and delivering feedback in a seamless, accessible manner. This layer leverages the smartphone’s camera to acquire visual data, supports voice interaction through integrated speech recognition, and audibly communicates results via a TTS engine. This hands-free interaction design is tailored to the needs of visually impaired users, enabling fluid access to system capabilities without the need for visual confirmation or manual control.
Underlying the UI is the application logic layer, which coordinates system behavior. It mediates interactions between the user and backend services, manages asynchronous requests, and encodes inputs for API transmission. The logic engine also interprets server responses, guiding decision-making around model invocation and fallback mechanisms.
A state management framework designed for real-time data flow and interface synchronization supports the logic layer. This layer implemented using reactive patterns (e.g., Riverpod [23]), ensures that API-derived results are propagated throughout the interface with minimal latency. It also maintains consistency between user actions, visual capture, and model predictions.
At the backend, the system relies on a cloud-hosted service layer where the core AI models are deployed. This includes YOLOv11 for object detection, OWL-ViT for open-vocabulary recognition, and BLIP for descriptive scene summarization. Together, these models provide complementary functionality—YOLOv11 offers high-speed recognition of trained categories, BLIP synthesizes image descriptions in natural language, and OWL-ViT enables zero-shot recognition of user-defined objects via textual queries.
The system’s mobile-cloud deployment strategy plays a critical role in reducing on-device computational demands. Inference is executed in the cloud, ensuring support even for mid-range smartphones with limited processing power. Meanwhile, the mobile client maintains a lightweight footprint, managing only interaction, request routing, and result delivery. This design not only enhances real-time usability but also simplifies model updates and scalability across different devices.
My Eye AI achieves an efficient architectural balance by decoupling the user interface from compute-heavy inference tasks. This enables accessibility, adaptability, and high-performance assistive capabilities within a practical, mobile-first deployment model.
1).USER INTERACTION AND WORKFLOW
When a visually impaired user issues a voice query (e.g., “What is in front of me?”), the interaction proceeds through six sequential stages:
- 1.Wake and Capture—The user activates the app by voice; a short sound confirms readiness. The camera captures one frame.
- 2.Preprocessing—The client normalizes the image and sends {image, query_text} to the cloud router API.
- 3.Routing—If the query matches a known class, YOLOv11 runs; otherwise, OWL-ViT handles the request.
- 4.Inference—YOLOv11 returns bounding boxes and confidence scores; OWL-ViT returns text-match scores; BLIP optionally generates a scene caption.
- 5.Fusion—The system merges detections using Soft Non-Maximum Suppression (NMS), preferring YOLO for known classes and OWL-ViT for novel terms.
- 6.Response—Results are converted to natural speech and displayed as large-text feedback on the phone screen.
This workflow clarifies how user intent is translated into real-time visual feedback through an accessible, hands-free process optimized for the visually impaired.
B.YOLOv11: OBJECT DETECTION FOR ASSISTIVE AI
To enable robust and responsive object detection within the My Eye AI system, we evaluated two variants of the YOLOv11 model architecture: Medium and X-Large. Both models were trained on custom datasets and assessed across multiple accuracy and generalization metrics. The Medium variant served as a baseline for performance, while the X-Large configuration was introduced to address limitations observed in recall, precision, and overfitting. The following subsections detail both models’ training procedures, configurations, and results.
1).FIRST RUN: YOLOv11 MEDIUM VARIANT
This experiment established a quantitative baseline and revealed limitations caused by class imbalance and overfitting, guiding later methodological refinement.
To establish a baseline for object detection performance, the YOLOv11 Medium variant was trained on a curated dataset derived from Google Open Images [23], comprising 83,089 annotated images spanning 397 object categories. Each class was capped at 250 images to maintain diversity while limiting dominance by overrepresented categories. All annotations were reformatted to match the YOLOv11 label structure.
The model was trained over 300 epochs using stochastic gradient descent (SGD) with an auto-adjusted learning rate schedule incorporating warmup stabilization. The input image size was fixed at 640 pixels, and the batch size was limited to 2 due to hardware constraints. The training took approximately 16.82 days due to hardware limitations. Training was conducted on a CUDA-enabled GPU using pretrained weights and resumed from the last checkpoint. The training setup also included early stopping with a patience of 100 epochs, warmup over the first three epochs, and automatic mixed precision enabled for efficiency. The optimizer parameters were configured with a base learning rate of 0.01, momentum of 0.937, and weight decay of 0.0005. Data augmentation techniques included Hue, Saturation, Value color-space perturbation, geometric transformations, RandAugment, and random erasing with a probability of 0.4. The loss function combined bounding box regression (box =7.5), classification loss (cls = 0.5), and distribution focal loss (DFL =1.5), balanced to support stable learning across object categories.
During training, loss metrics decreased steadily: box loss [24] declined from 1.2 to 0.8246, classification loss dropped from 3.0 to 1.032, and DFL fell from 1.46 to 1.1674.
As shown in the training and validation loss curves (Fig. 2–5), both the box loss (Fig. 2) and classification loss (Fig. 3) during training exhibit a steady downward trend, indicating effective learning. However, the validation box loss (Fig. 4) and validation classification loss (Fig. 5) begin to increase after epoch 263, signaling the onset of overfitting. This divergence suggests that the model starts to memorize the training data rather than generalizing well to unseen samples.
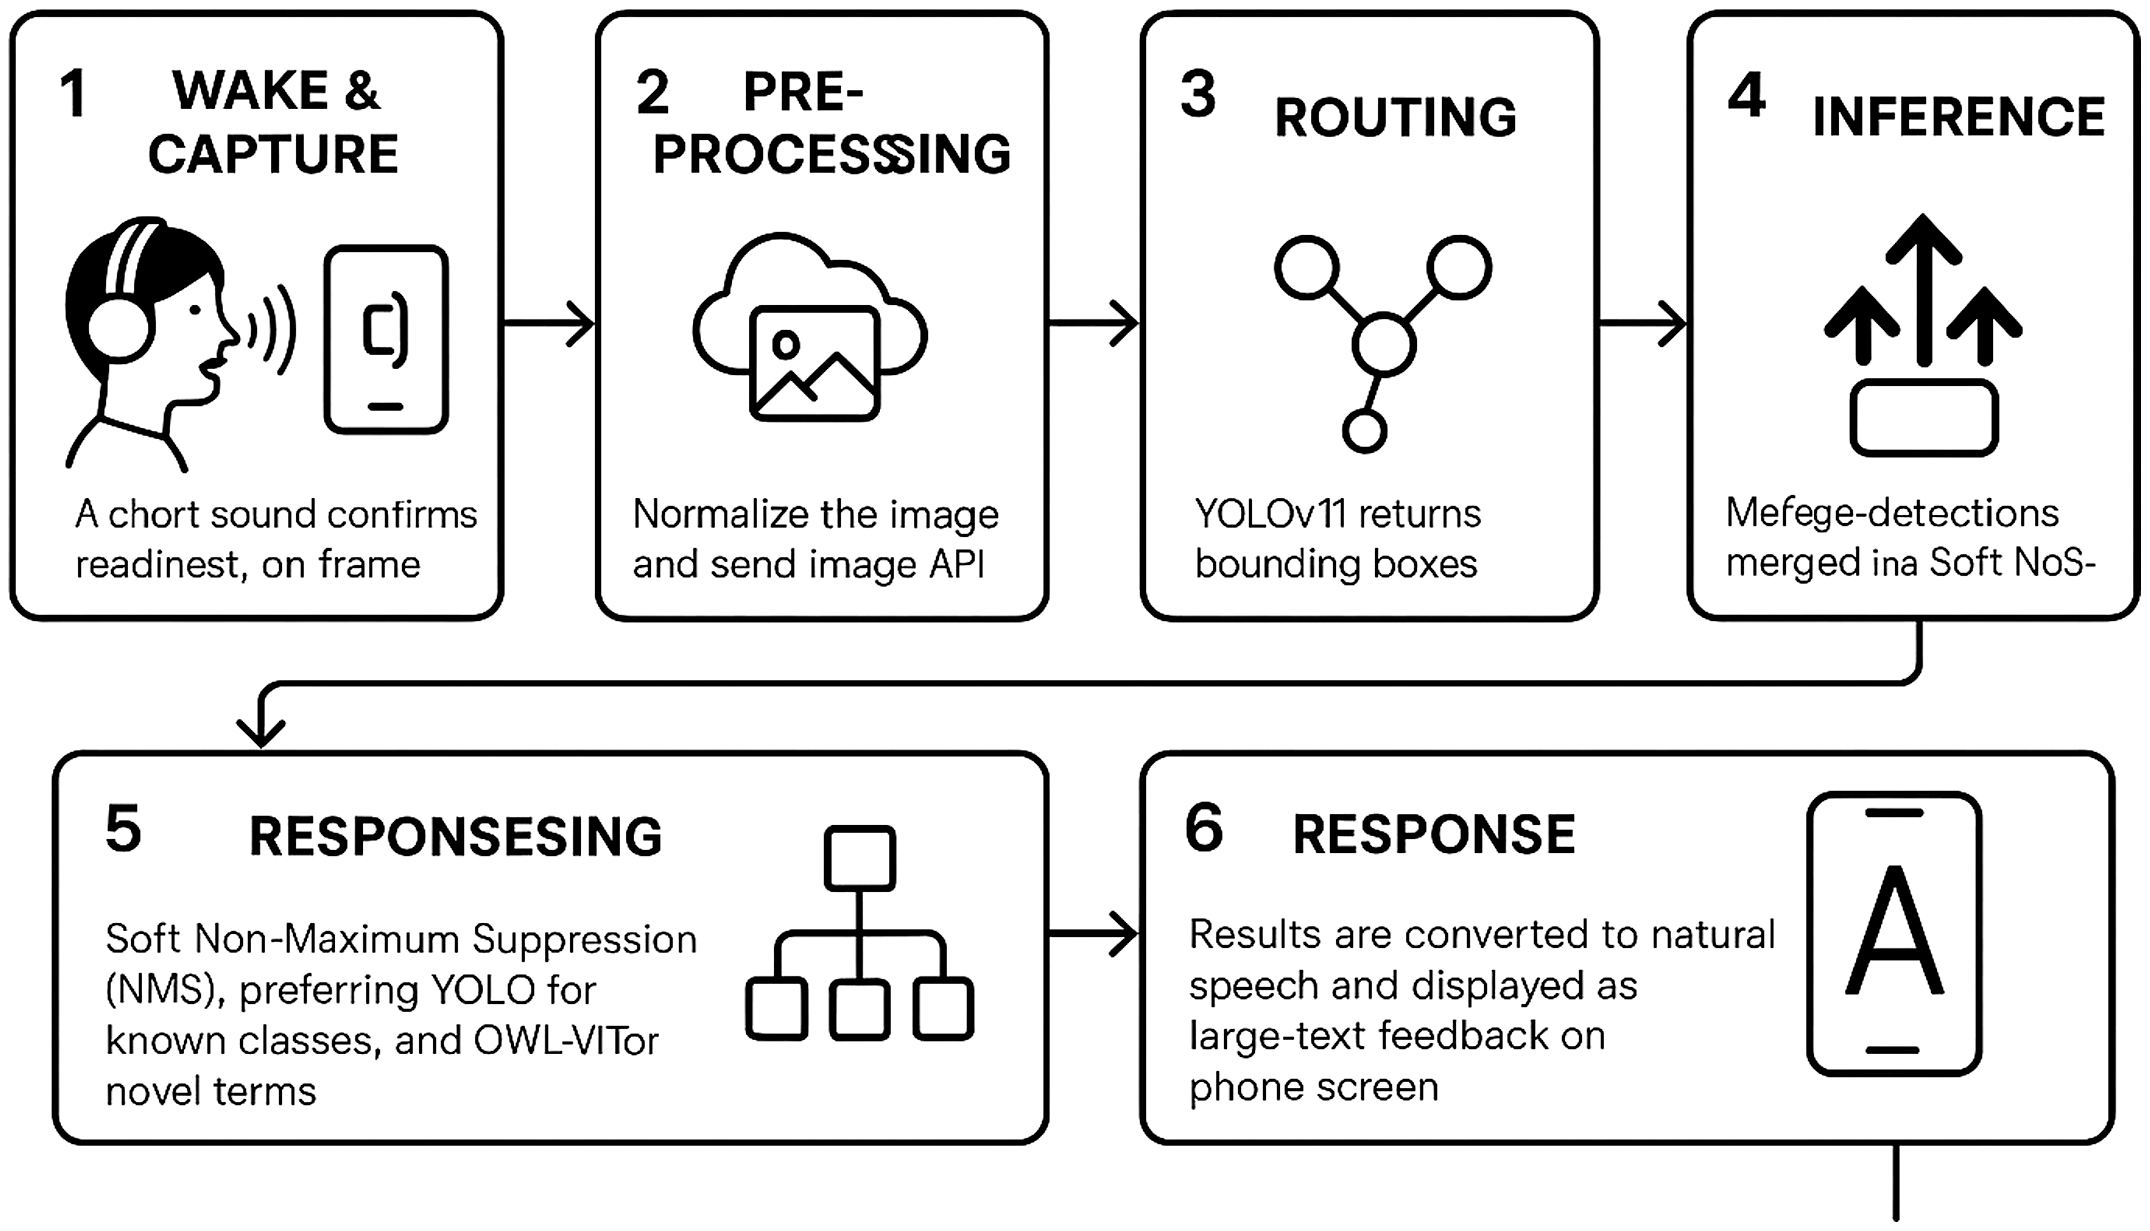 Fig. 2. User interaction and workflow of My Eye AI.
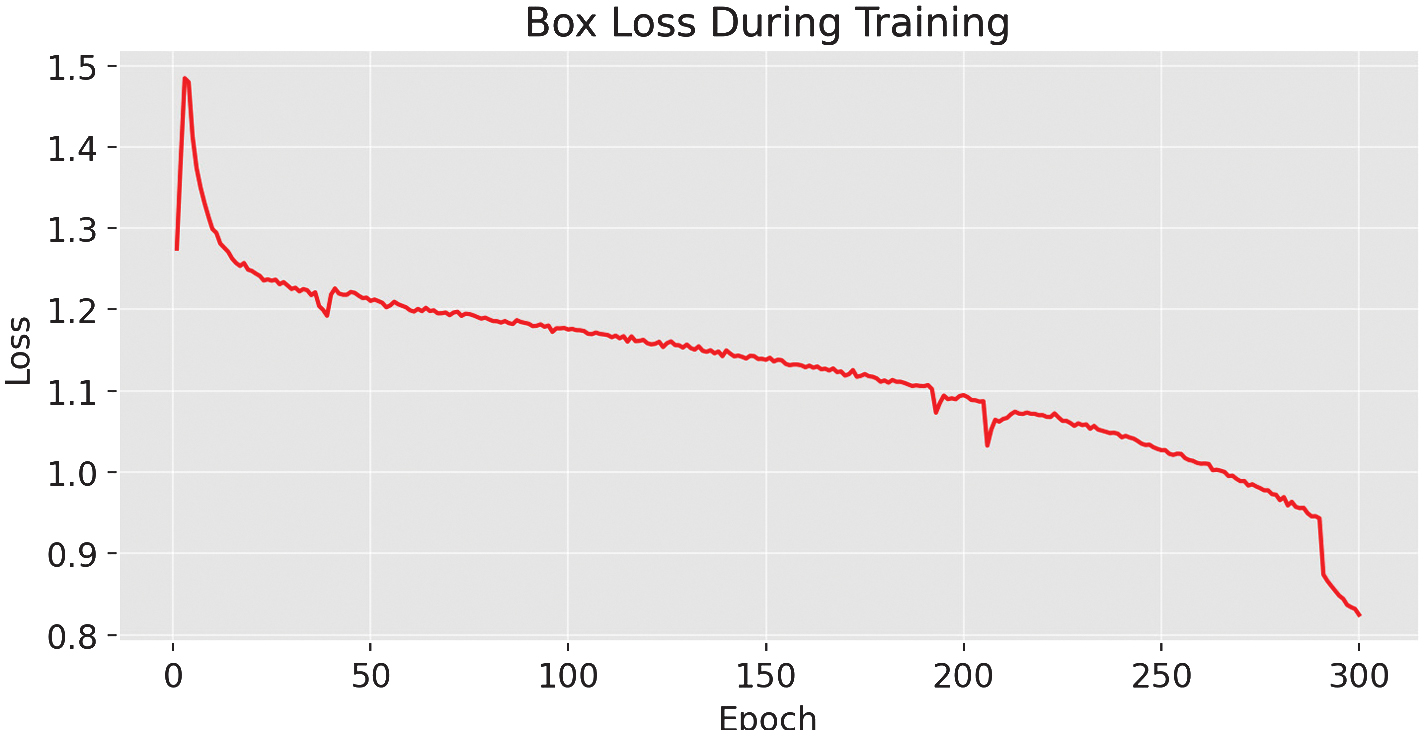 Fig. 3. The box-loss metric during training of the YOLOv11-m variant.
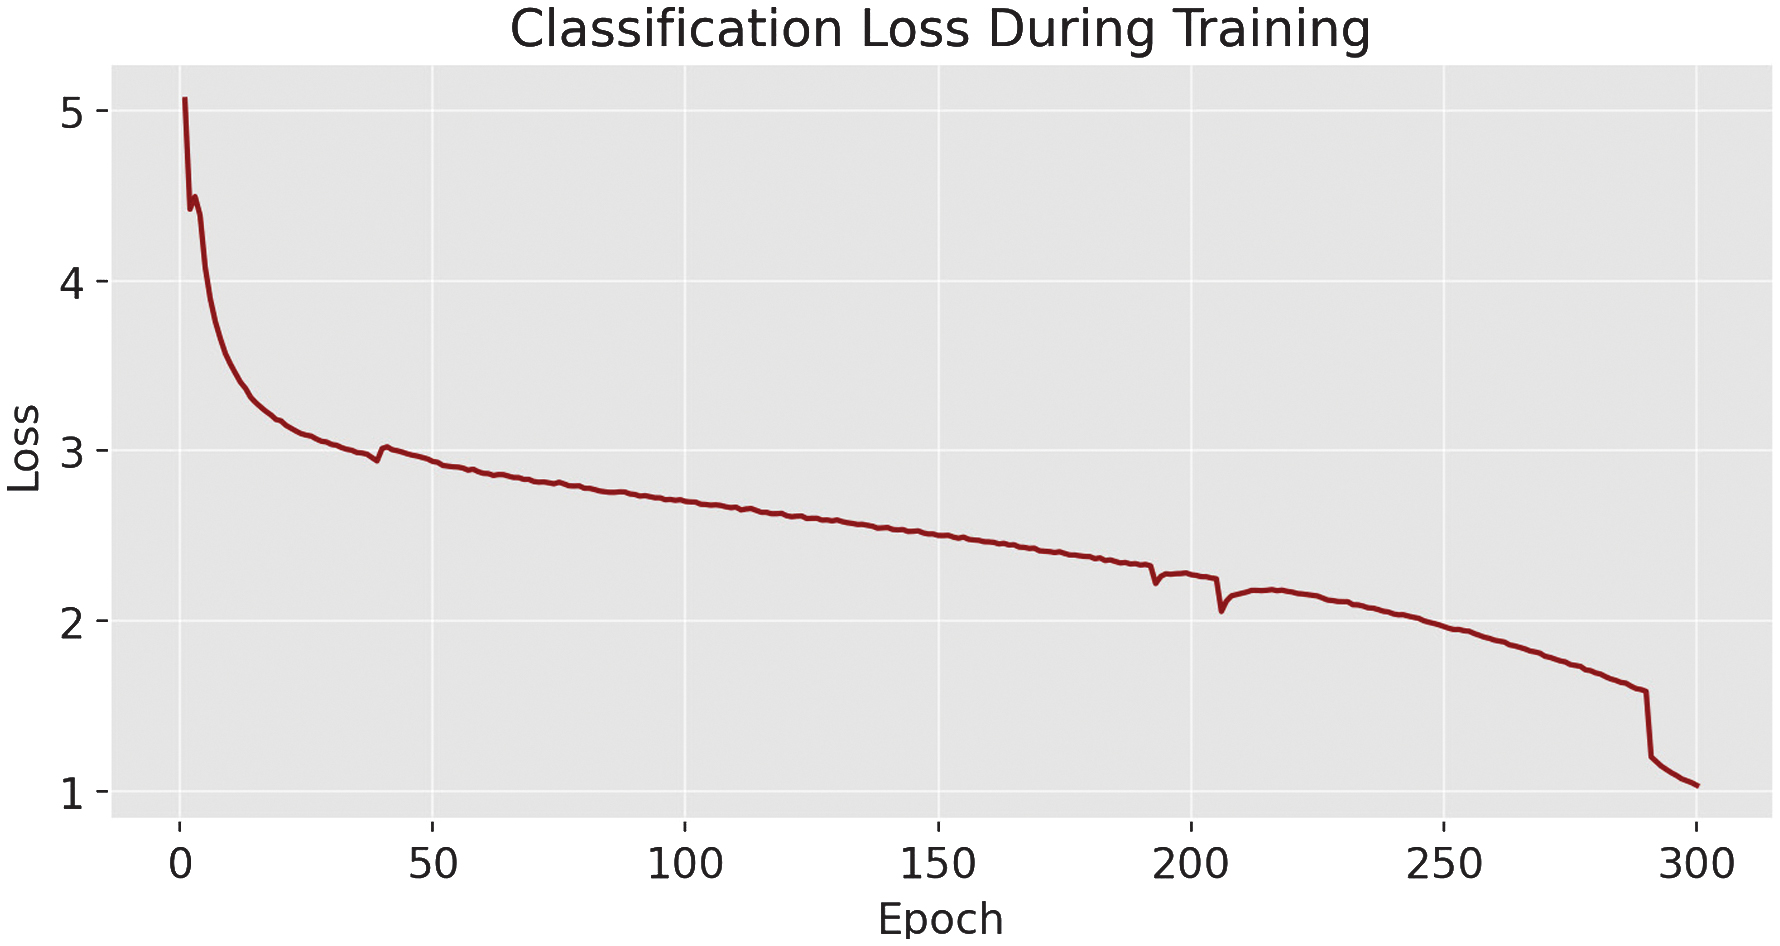 Fig. 4. The classification-loss metric during training YOLOv11-m.
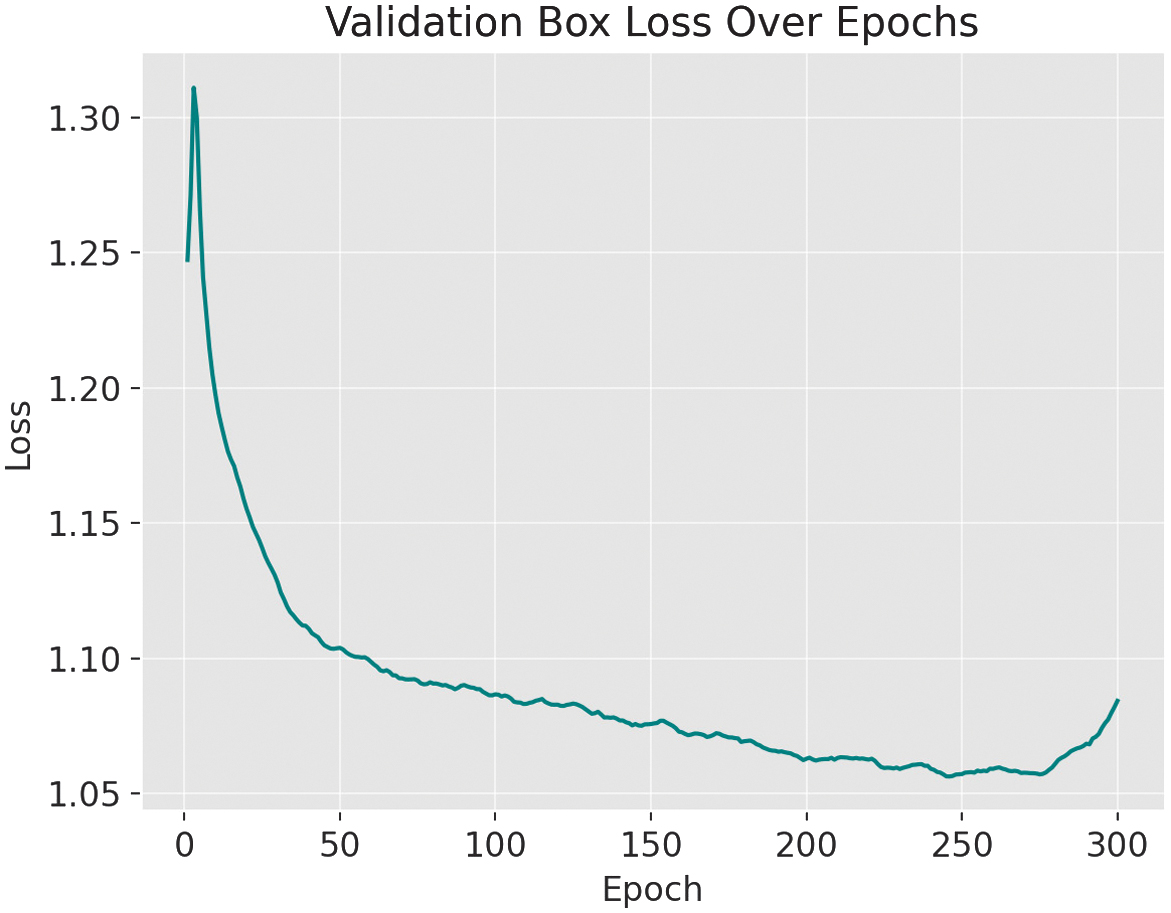 Fig. 5. During validation of the YOLOv11-m variant, the box-loss metric indicates overfitting after epoch 263.
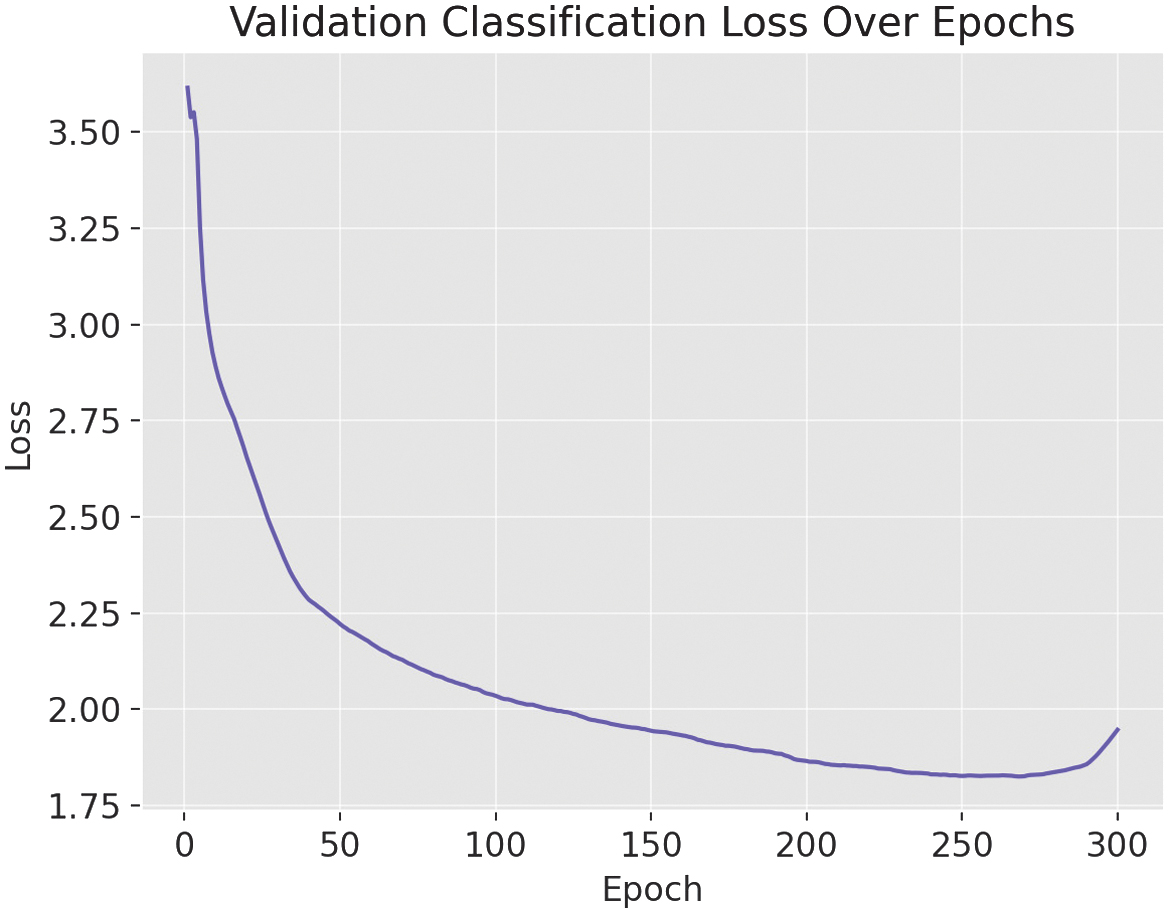 Fig. 6. The classification-loss metric during validation of the YOLOv11-m variant.
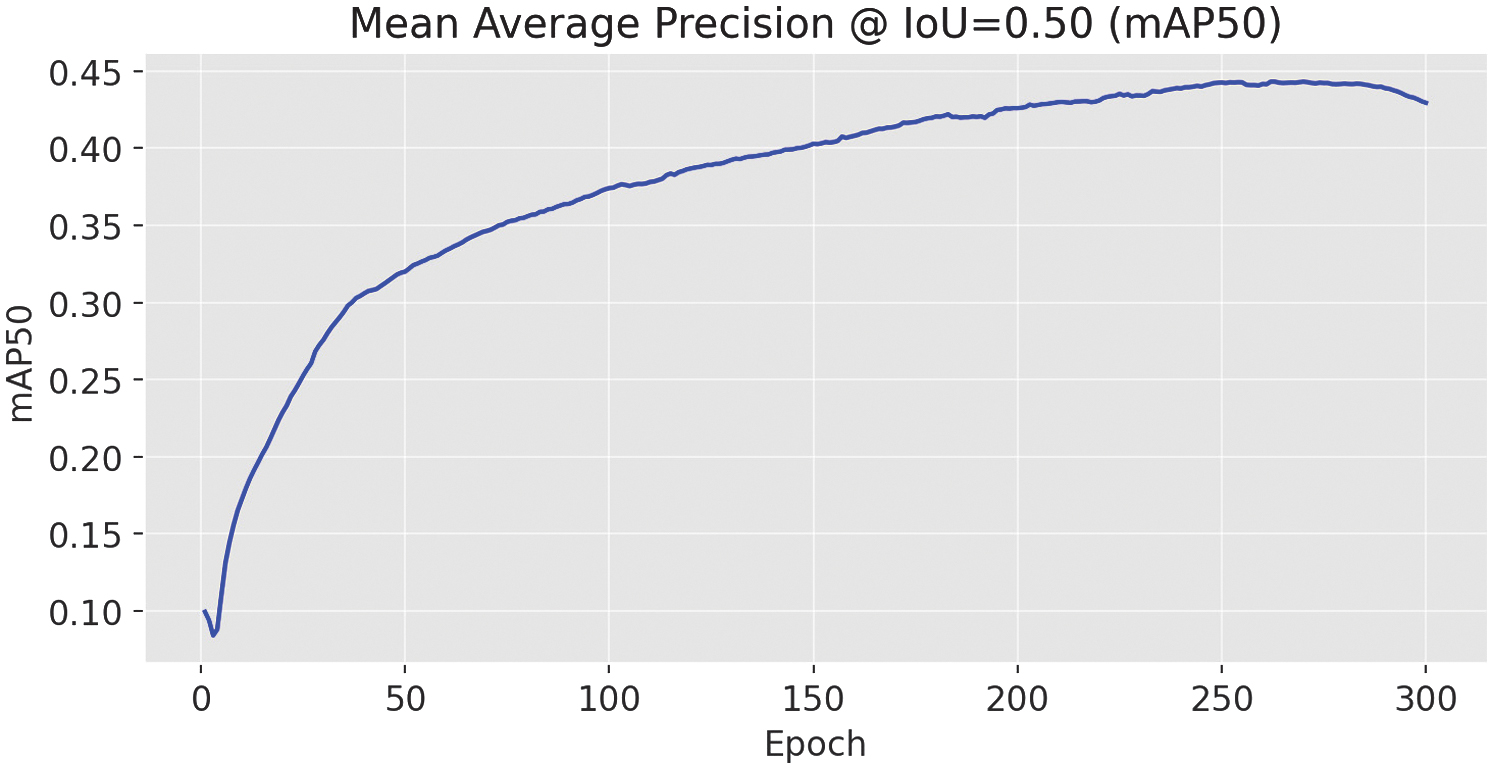 Fig. 7. mAP@0.5 results for the YOLOv11-m variant.
The final model performance was modest. The mean average precision [24] at intersection over union (IoU) threshold 0.5 (mAP50) was 0.443.
While mAP50–95 scored 0.329.
Precision reached 0.489 (see Fig. 8) and recall 0.457, leading to an F1 score of 0.43 at epoch 263.
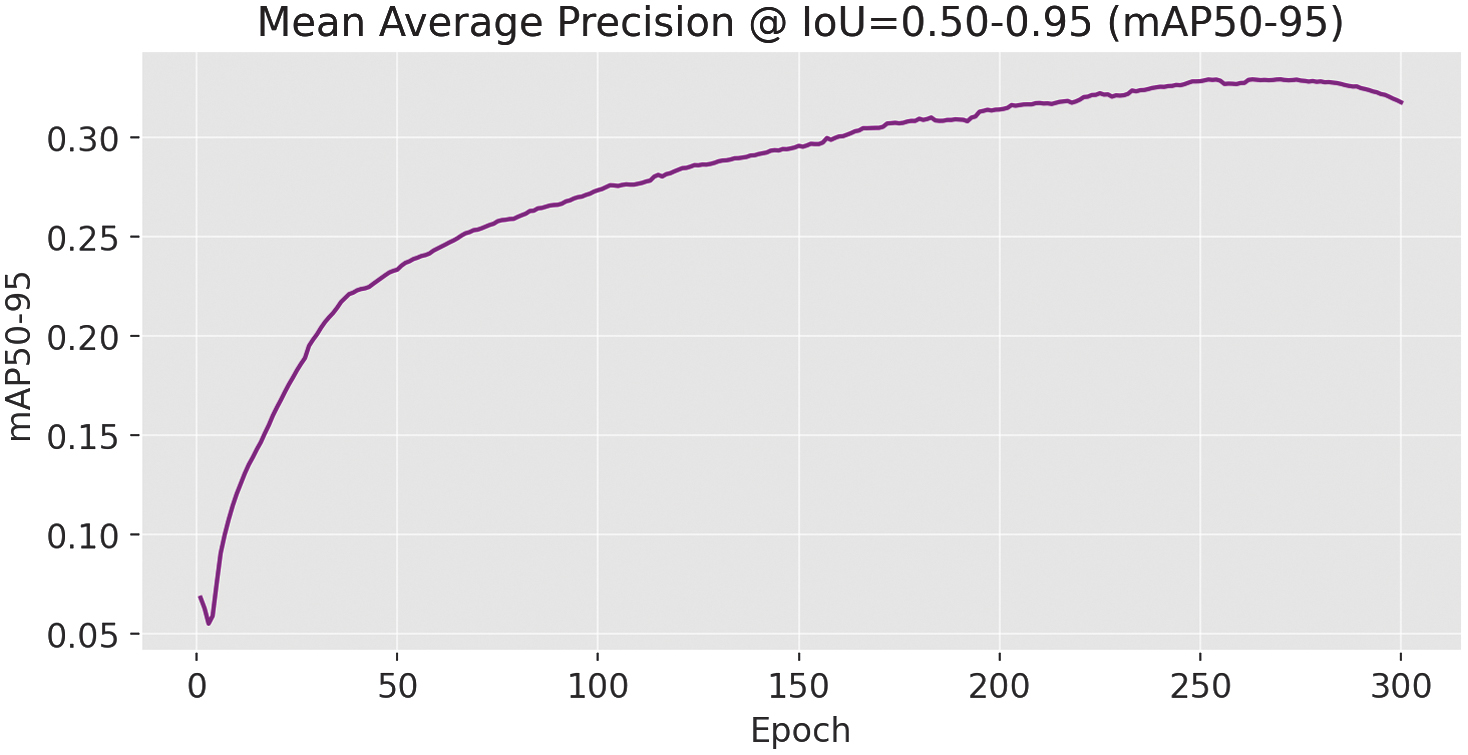 Fig. 8. mAP@0.5–0.95 results for the YOLOv11-m variant.
The recall results are shown in Fig. 9, while the F1-confidence curve (Fig. 10) highlights the optimal confidence threshold where the trade-off between precision and recall is maximized. As illustrated in the precision–confidence curve (Fig. 11), precision steadily improves with higher confidence thresholds, reaching 1.0 at the cost of recall. The recall–confidence curve (Fig. 13) shows the opposite effect: high recall at low thresholds, but a steep decline as the threshold rises. At a confidence of 0.215, the model achieves its highest F1 score of 0.43, making it the ideal operational point for minimizing misclassification risk while maintaining reliable detections.
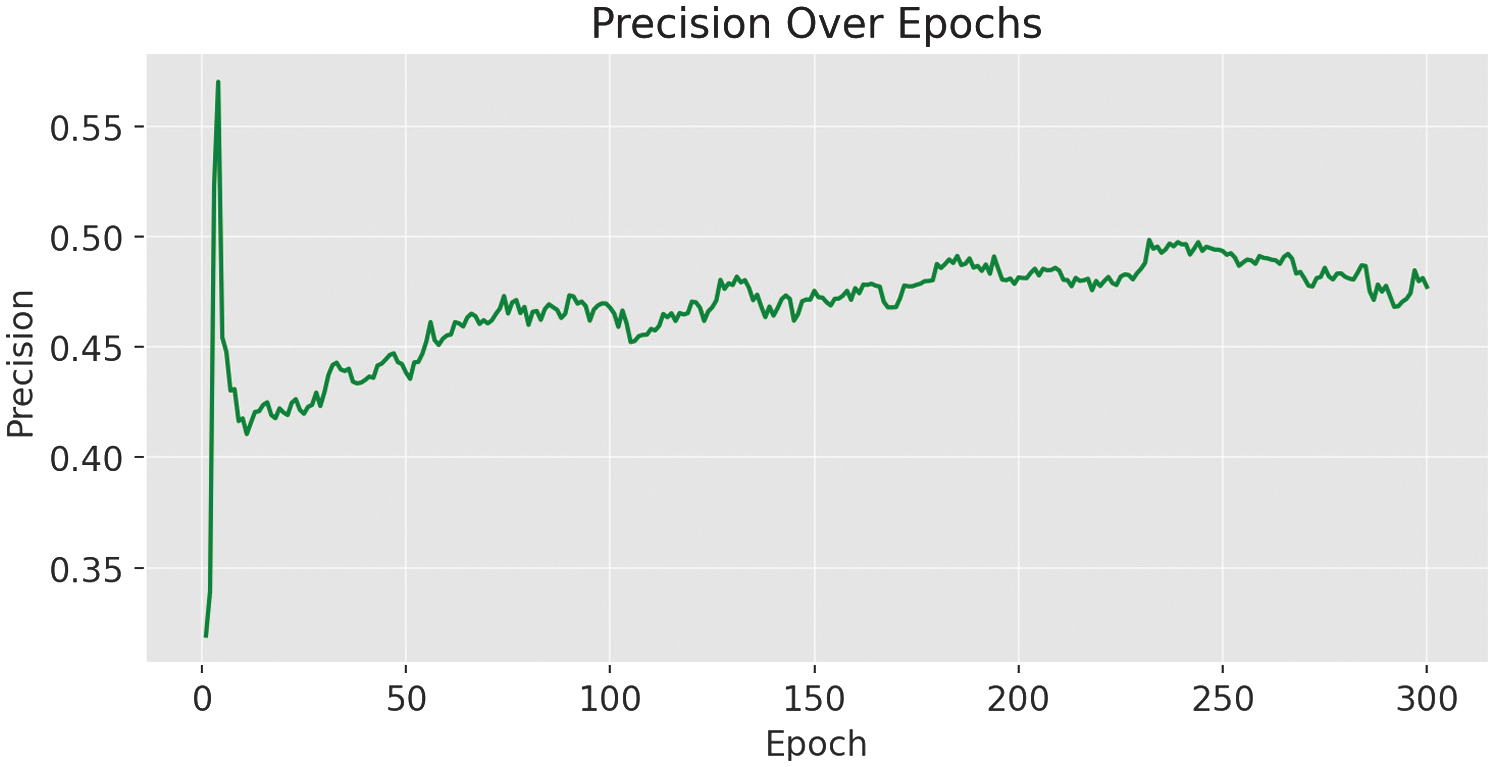 Fig. 9. Precision metrics for the YOLOv11-m variant.
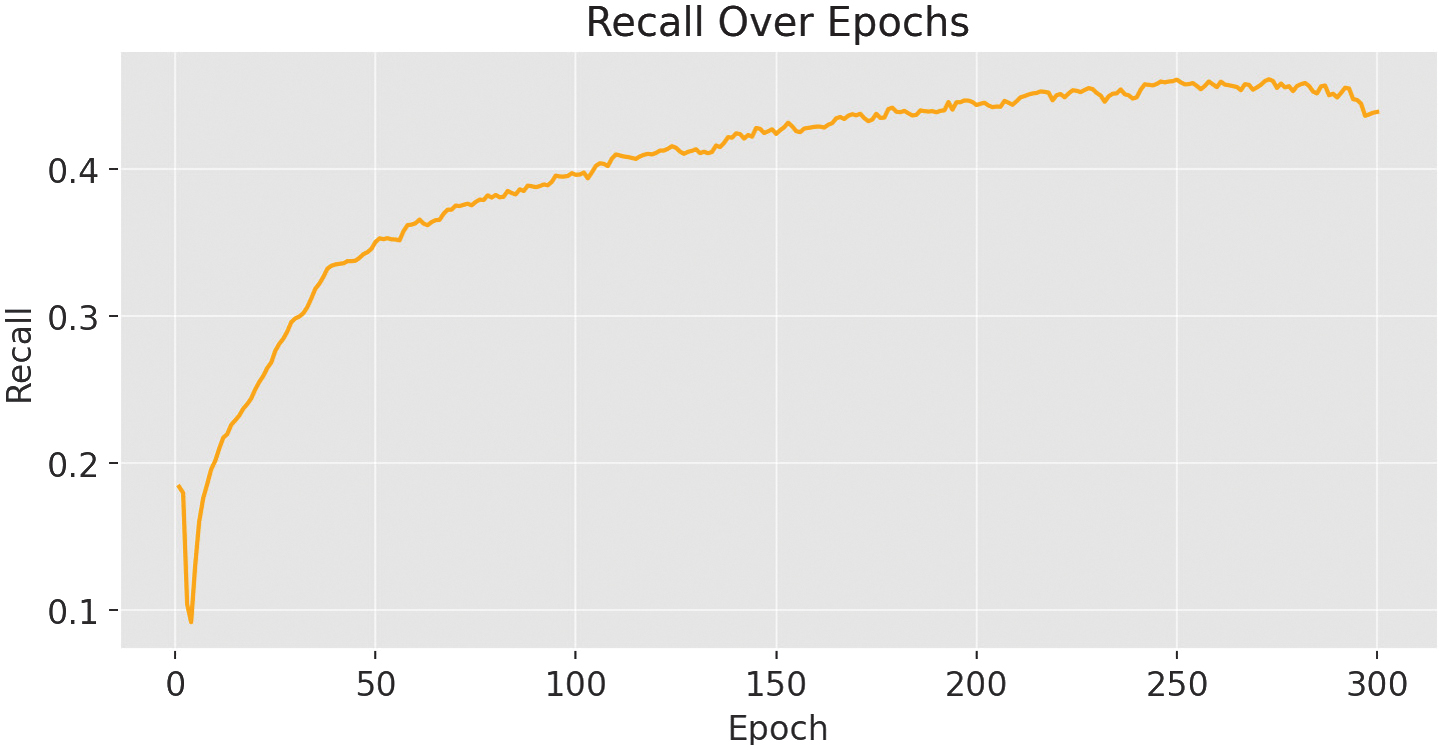 Fig. 10. Recall metrics for the YOLOv11-m variant.
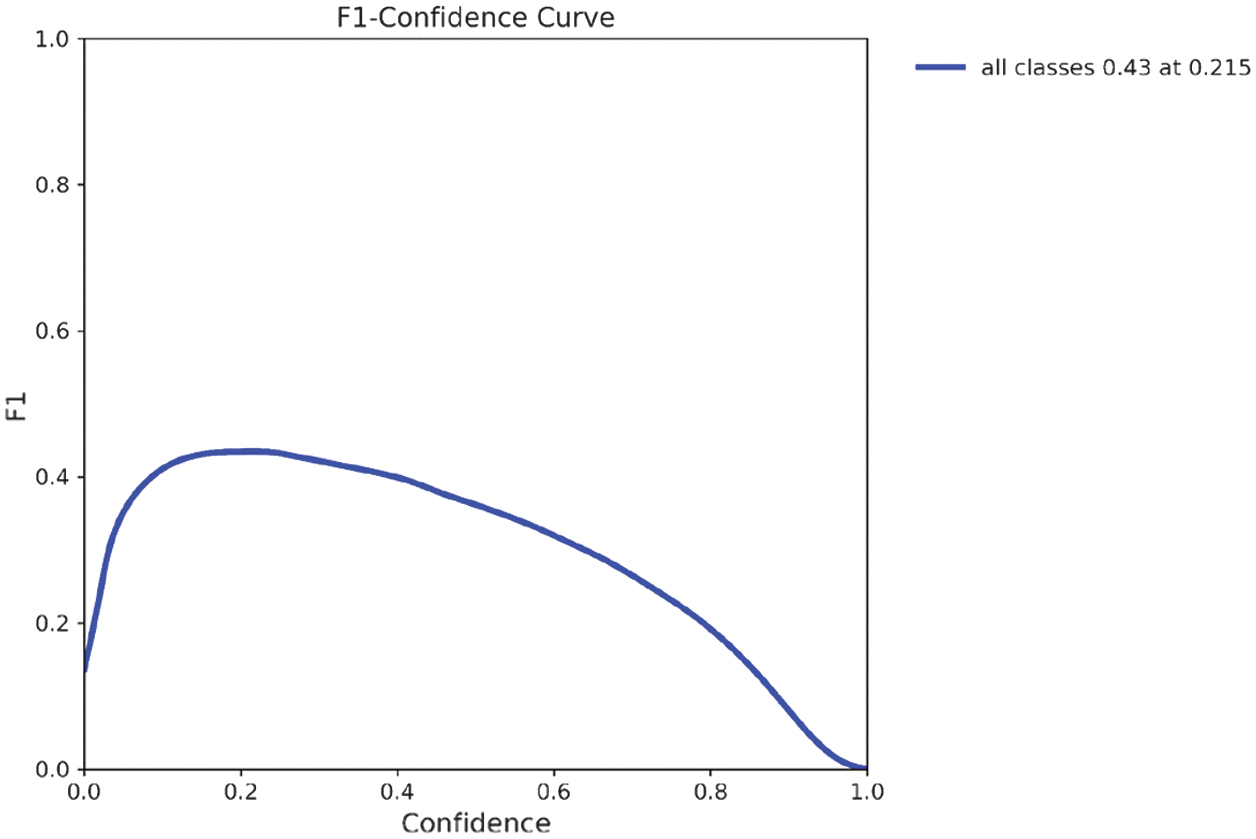 Fig. 11. F1-score for the YOLOv11-m variant.
As illustrated in the precision–confidence curve (Fig. 11), model precision improves steadily as the confidence threshold increases. While precision reaches 1.0 at high thresholds, this comes at the cost of recall, suggesting fewer detections are made. This supports the need to balance threshold selection carefully depending on the application’s tolerance for false negatives.
The precision–recall (PR) curve shown in Fig. 12 evaluates the performance of the YOLOv11-m model across varying confidence thresholds. The blue curve aggregates detection performance across all object classes.
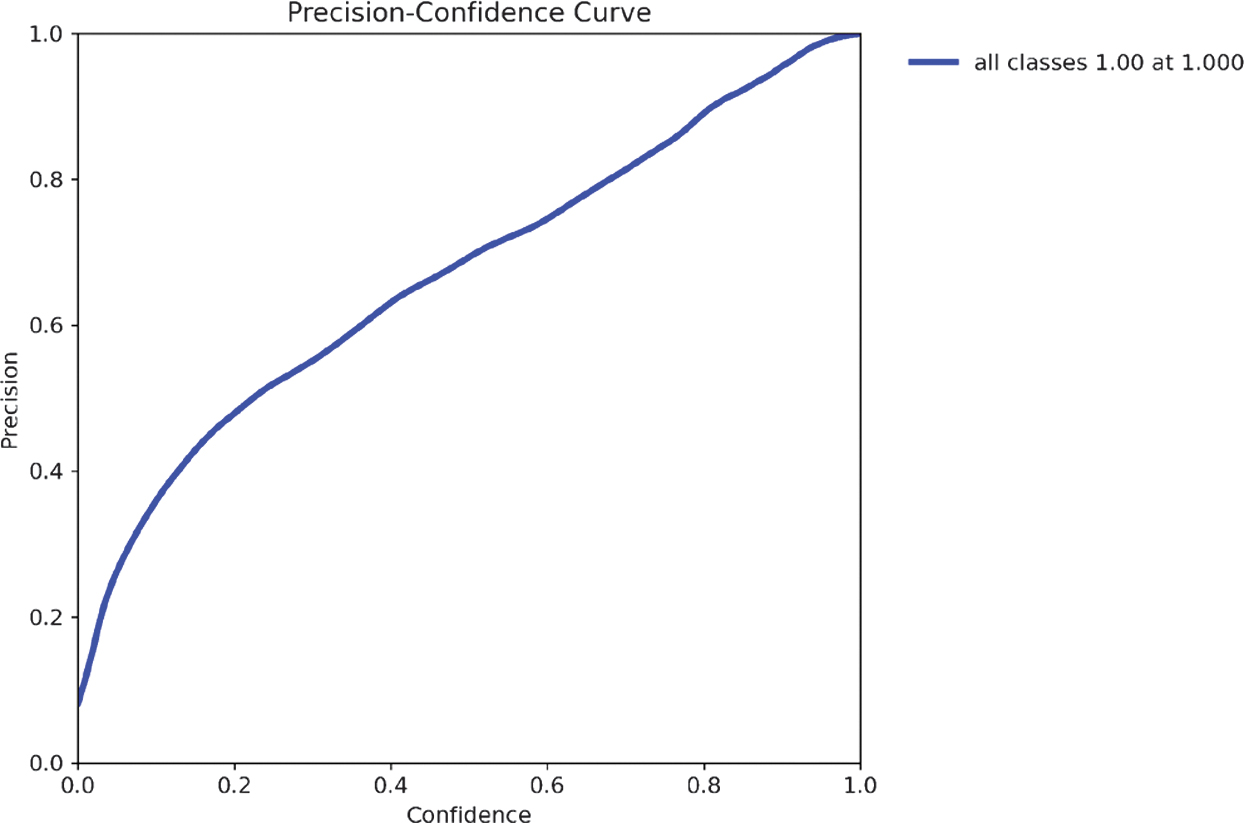 Fig. 12. Precision Curve for YOLOv11-m variant.
The model achieves a mean average precision at IoU = 0.5 (mAP@0.5) of 0.443, meaning it correctly detects objects with at least 50% bounding box overlap 44.3% of the time. While this demonstrates promising potential for assistive applications, particularly given the dataset’s wide variety of objects and environments, the current performance remains insufficient for reliable real-world deployment. Further improvements in accuracy, robustness under varied lighting and occlusion conditions, and support for unseen object classes are necessary to ensure the system meets the demands of everyday use by visually impaired individuals.
The downward slope of the PR curve reflects the typical trade-off in object detection: as recall increases (i.e., more true objects are detected), precision generally decreases due to an increase in false positives. The curve’s shape also suggests moderate class imbalance and variability in detection difficulty across object categories.
The recall–confidence curve (Fig. 13) shows that the model captures most objects at low confidence thresholds, peaking at 0.80. However, recall drops significantly as the threshold rises, highlighting the trade-off between model certainty and object detection coverage. These dynamics are crucial when deploying the model in safety-critical assistive applications, where high recall is often prioritized.
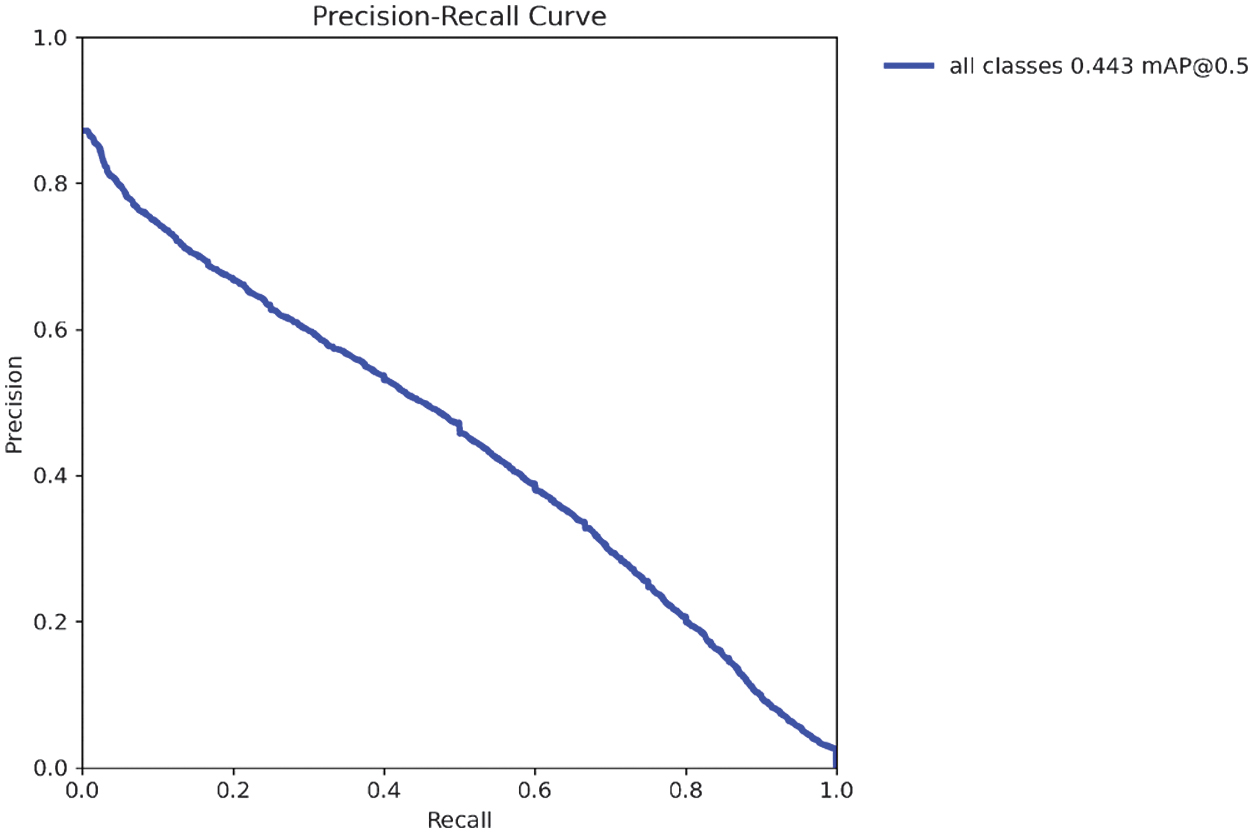 Fig. 13. Precision-Recall Curve for YOLOv11-m variant.
In further analysis of model performance, we observed recurring issues with false positives and missed detections, partly attributable to dataset-related factors. The class imbalance across categories is shown in Fig. 14, which illustrates overrepresented and underrepresented classes. The correlogram of labels (Fig. 15) further highlights spatial biases, where most bounding boxes are concentrated near the image center, potentially limiting detection of peripheral objects. The model’s class distribution reveals that some categories contain over 1600 instances, while others have fewer than 50. This imbalance leads to skewed learning behavior, where the model performs well on frequent classes but struggles to generalize across underrepresented ones.
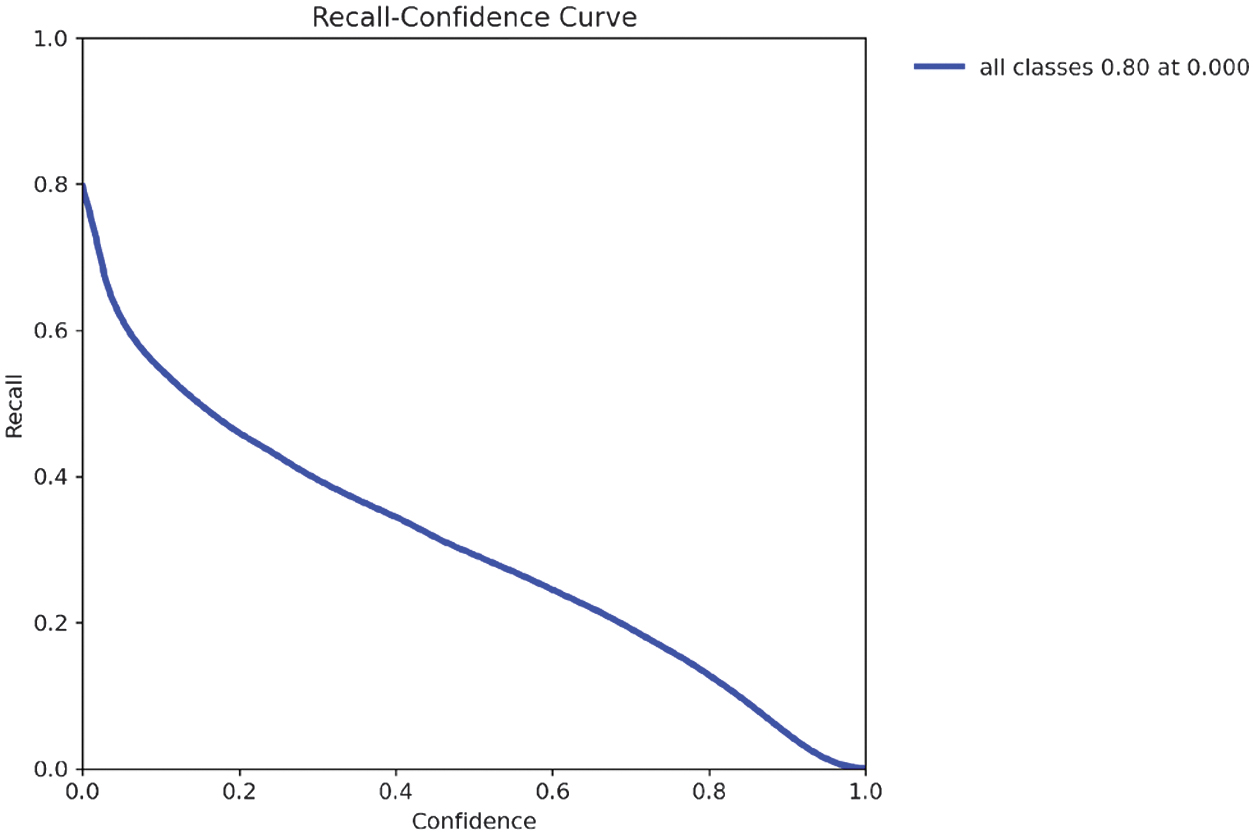 Fig. 14. Recall Curve for the YOLOv11-m variant.
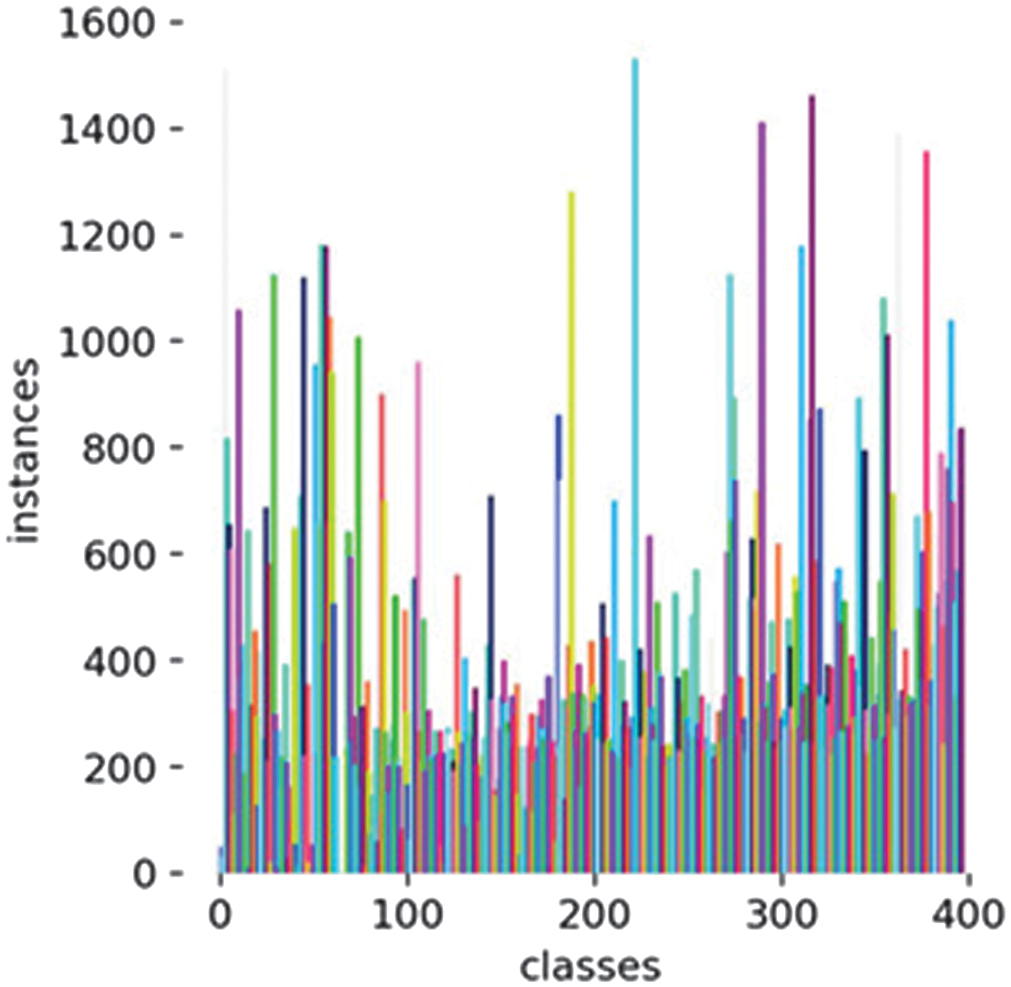 Fig. 15. Class imbalance for YOLOv11-m variant.
Beyond class frequency, the spatial characteristics of the labeled objects also impact detection performance. The correlogram analysis shows that most bounding boxes have relatively small width and height, suggesting that the dataset primarily contains small objects. Furthermore, the x and y center coordinates are concentrated around 0.5, indicating that objects are often located near the center of the image. This spatial bias may hinder the model’s ability to detect peripheral objects, especially if real-world scenes contain items near image edges or in varied positions not well represented during training.
The off-diagonal scatter plots (6 scatterplots) show the correlation between each pair of variables.
(x, y) form a cross-like shape, suggesting a central concentration of data.
While (x, width) and (y, height) show a triangle distribution indicating a dependency, objects near the center tend to have larger bounding boxes, for example, when width decreases, and x moves away from the center. The model might expect bigger objects in the center and struggle with detecting smaller objects.
(width, height): Appears skewed, meaning that small width values dominate, and the model might struggle to detect larger objects properly.
(y, width) & (x, height): Show mirrored patterns of the x-y relationship. (y, width) shows that objects near the center in the y-axis (x ≈ 0.5) tend to have larger widths. In contrast, objects closer to the top (y ≈ 1) or bottom (y ≈ 0) are narrower, which suggests spatial correlation where objects’ width changes depending on y-position.
(x, height) shows objects near the center in the x-axis (x ≈ 0.5) tend to be taller, while objects closer to the edges (x ≈0 or x ≈ 1) are shorter.
The model kept improving since all the (box_loss, cls_loss, dfl_loss) continued to decrease. mAP50(B) reached the highest value of 0.443; after that, it started decreasing, which indicates that the model is overfitting.
The findings underscored several takeaways: The mAP50 value of 0.443 was insufficient for practical use, as the model missed 55.7% of objects. An imbalanced dataset contributed to poor generalization and bias toward the majority classes.
The relatively small image size of 640 pixels may have limited the model’s ability to capture fine details.
Overfitting became apparent after epoch 263, where training performance continued improving while validation performance declined. The model also struggled with fine-grained object detection, indicating a need for better generalization techniques.
The validation process is further illustrated through batch labels and predictions, as shown in Fig. 16 and 17.
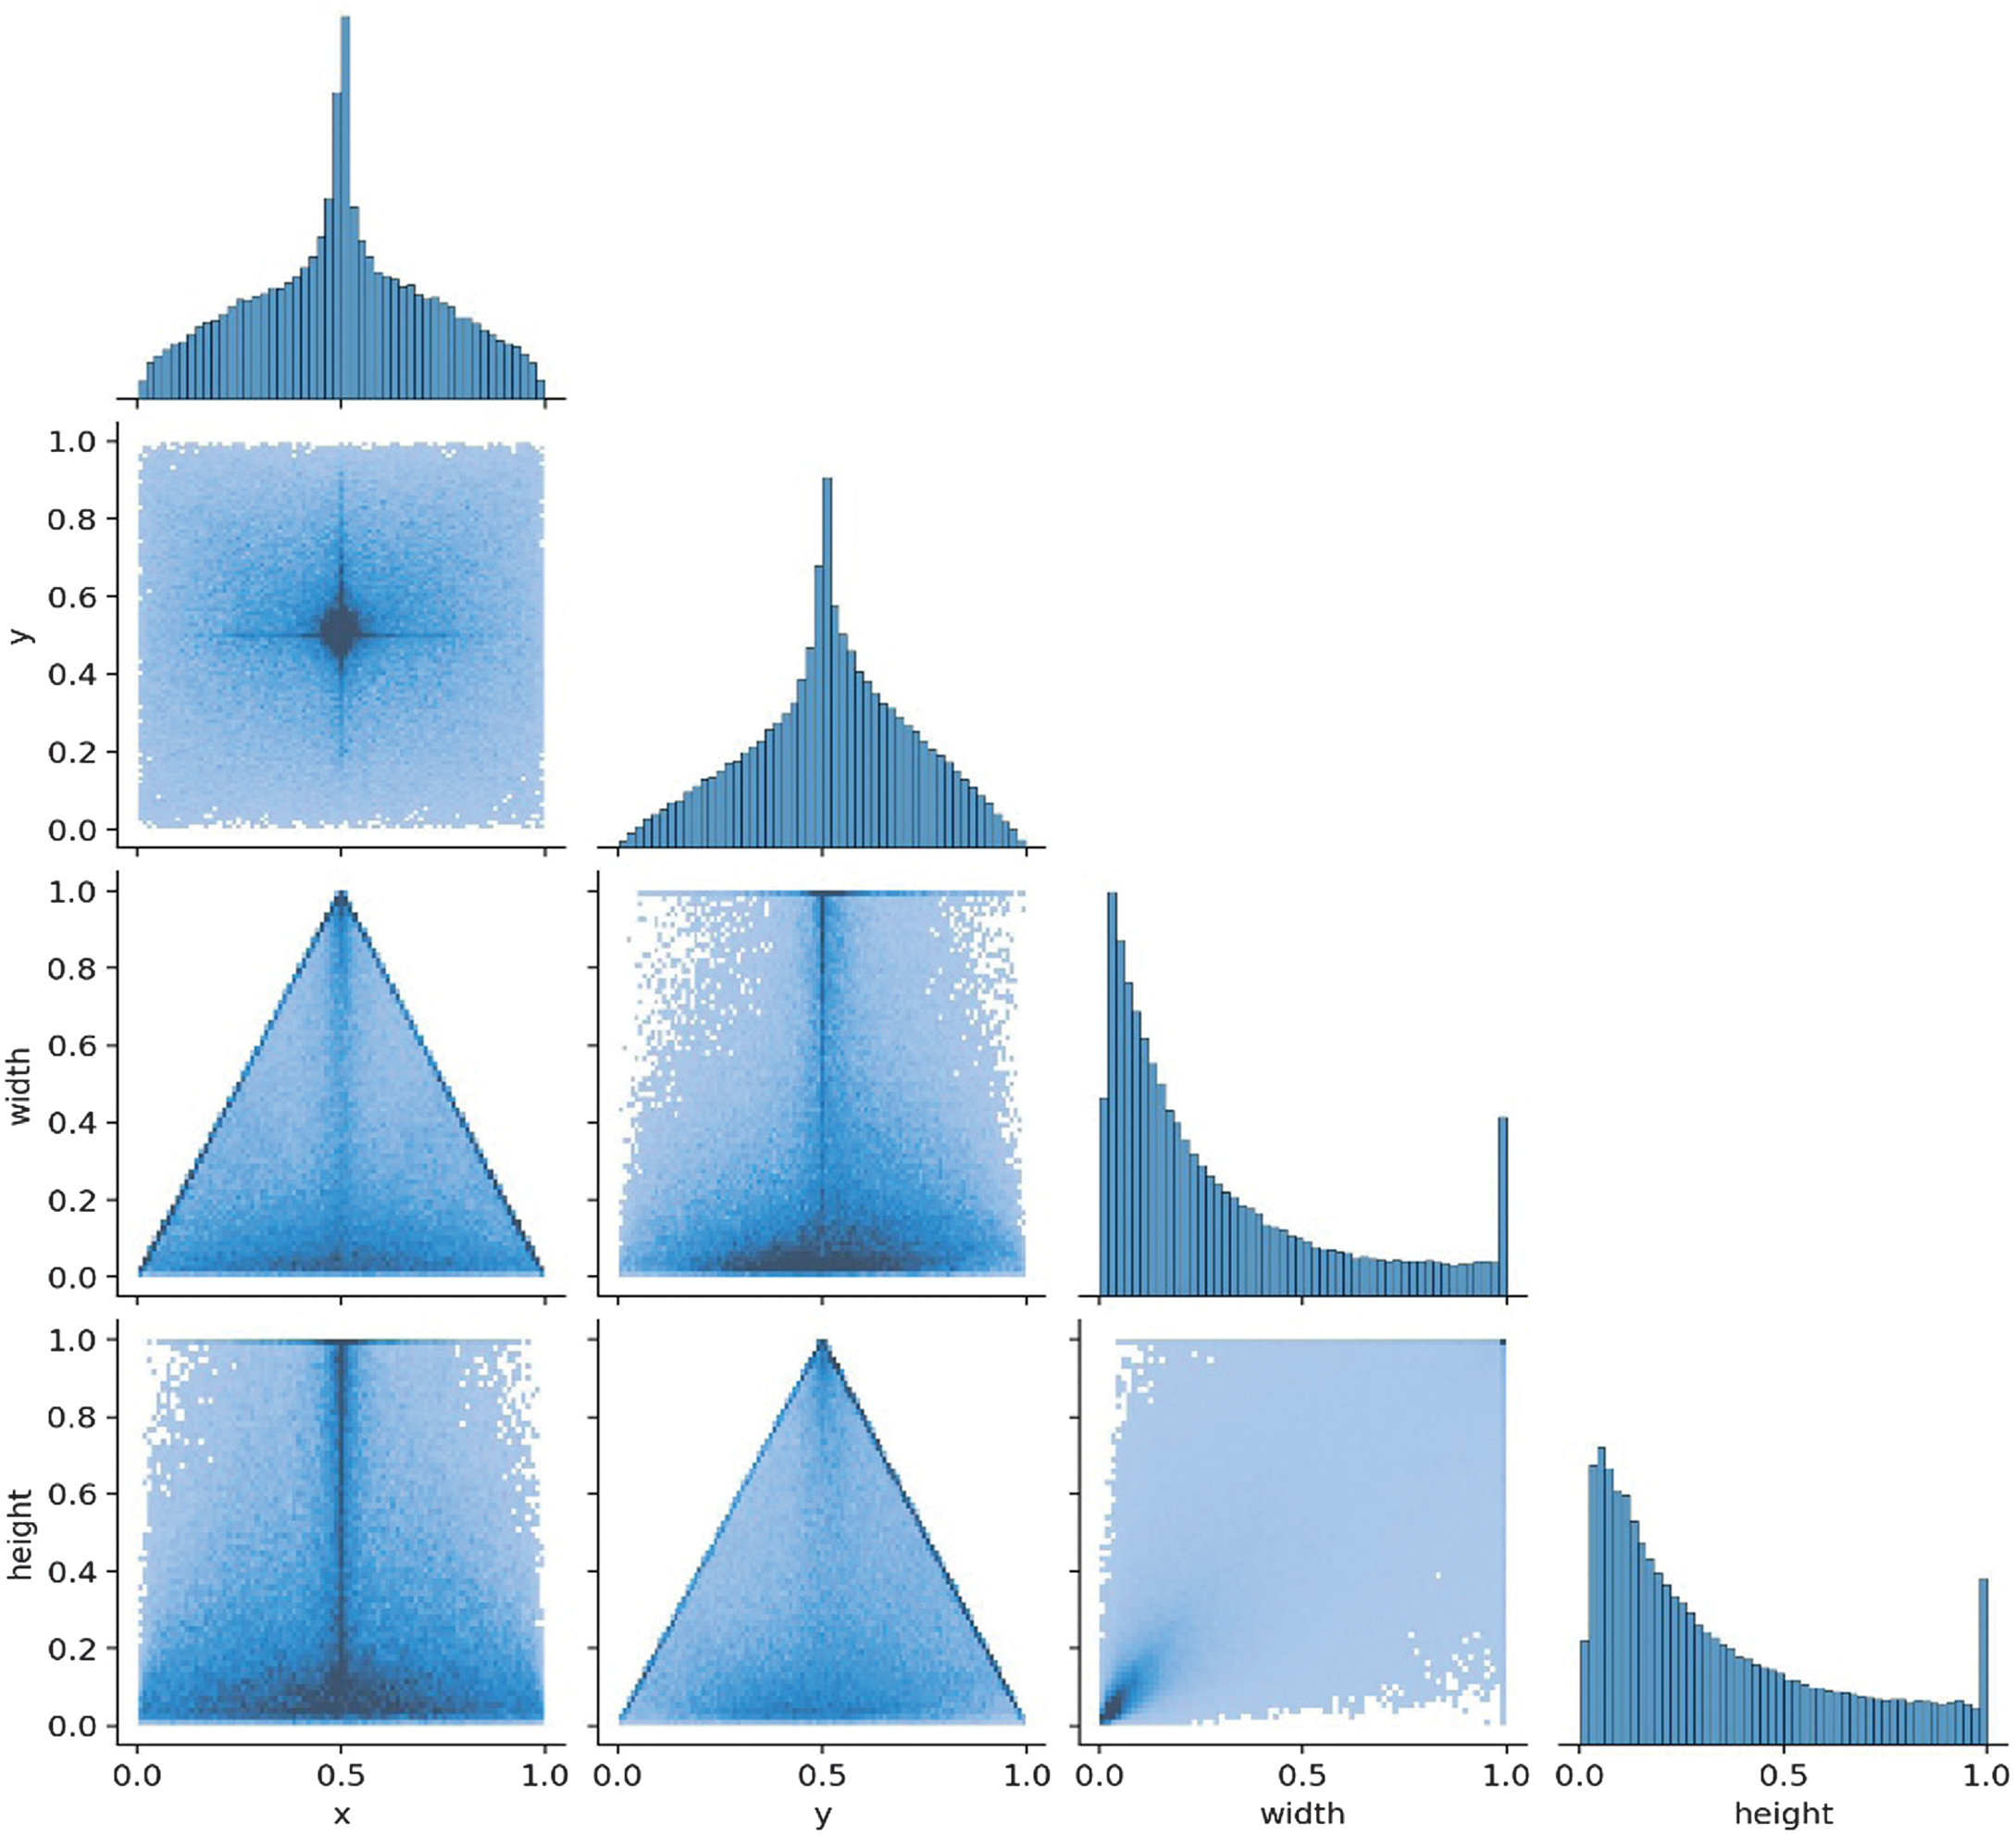 Fig. 16. Labels correlogram for YOLOv11-m variant.
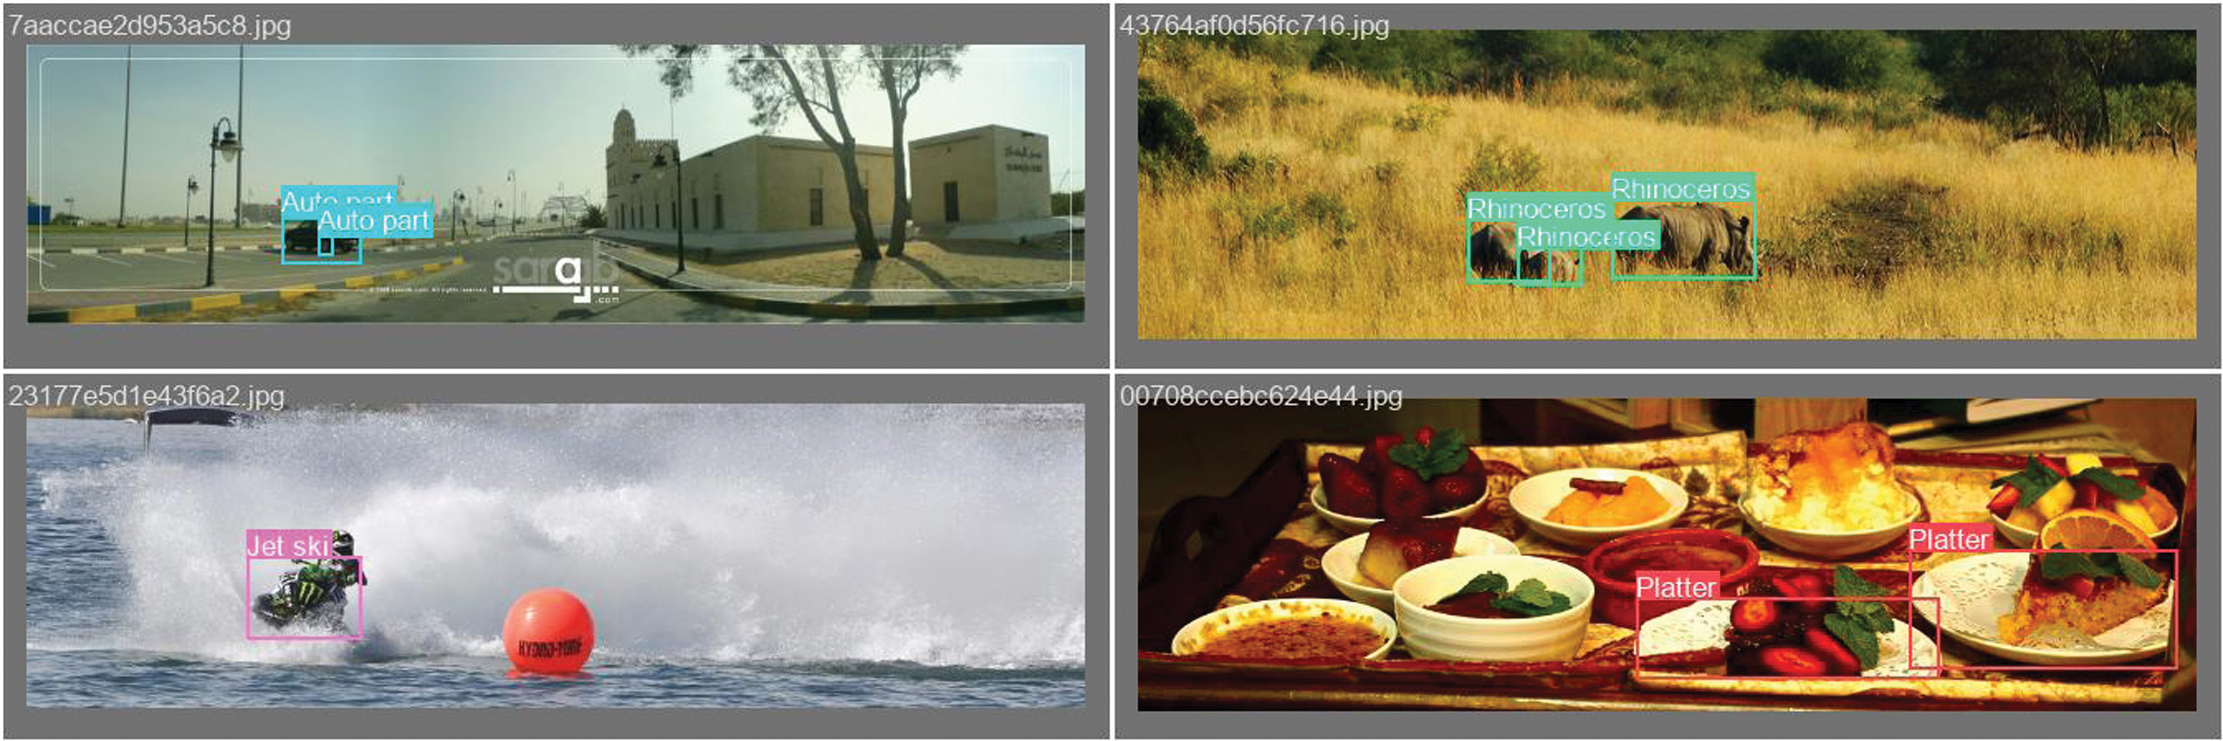 Fig. 17. Validation Batch Labels for YOLOv11-m variant. Source images are from the Google Open Images dataset, which shows actual annotations for images.
2).SECOND RUN: YOLOv11 X-LARGE VARIANT
To overcome the limitations of the medium variant, particularly in precision, recall, and overfitting, we retrained the YOLOv11 X-Large model using an enhanced training configuration and a more refined dataset. This version of the model was trained on 56,521 images across 91 carefully balanced categories, each capped at 1,000 samples to mitigate class imbalance. The input resolution was increased to 768 pixels to improve fine-grained object detection accuracy, the maximum supported within Google Colab Pro+ memory constraints.
Training was conducted for 175 epochs with a batch size of 16 and four data loader workers, the hardware’s maximum allowable configuration to ensure faster data throughput. While optimizer settings (SGD with a base learning rate of 0.01 and momentum of 0.937) and loss weights (box = 7.5, cls = 0.5, Dfl = 1.5) remained consistent with the medium variant to enable fair comparison, the improved dataset and architectural scaling led to significantly better performance.
Validation peaked at epoch 132, after which overfitting emerged, indicating the need for additional regularization. The X-Large model demonstrated substantial performance gains: mAP@0.5 rose from 0.443 to 0.578, mAP@0.5–0.95 improved from 0.329 to 0.451, and the F1 score increased from 0.43 to 0.56. Precision and recall also improved to 0.549 and 0.603, respectively. These gains are visualized in updated evaluation plots (Fig. 17–20), reflecting a stronger balance between precision and recall and broader detection coverage across diverse object types.
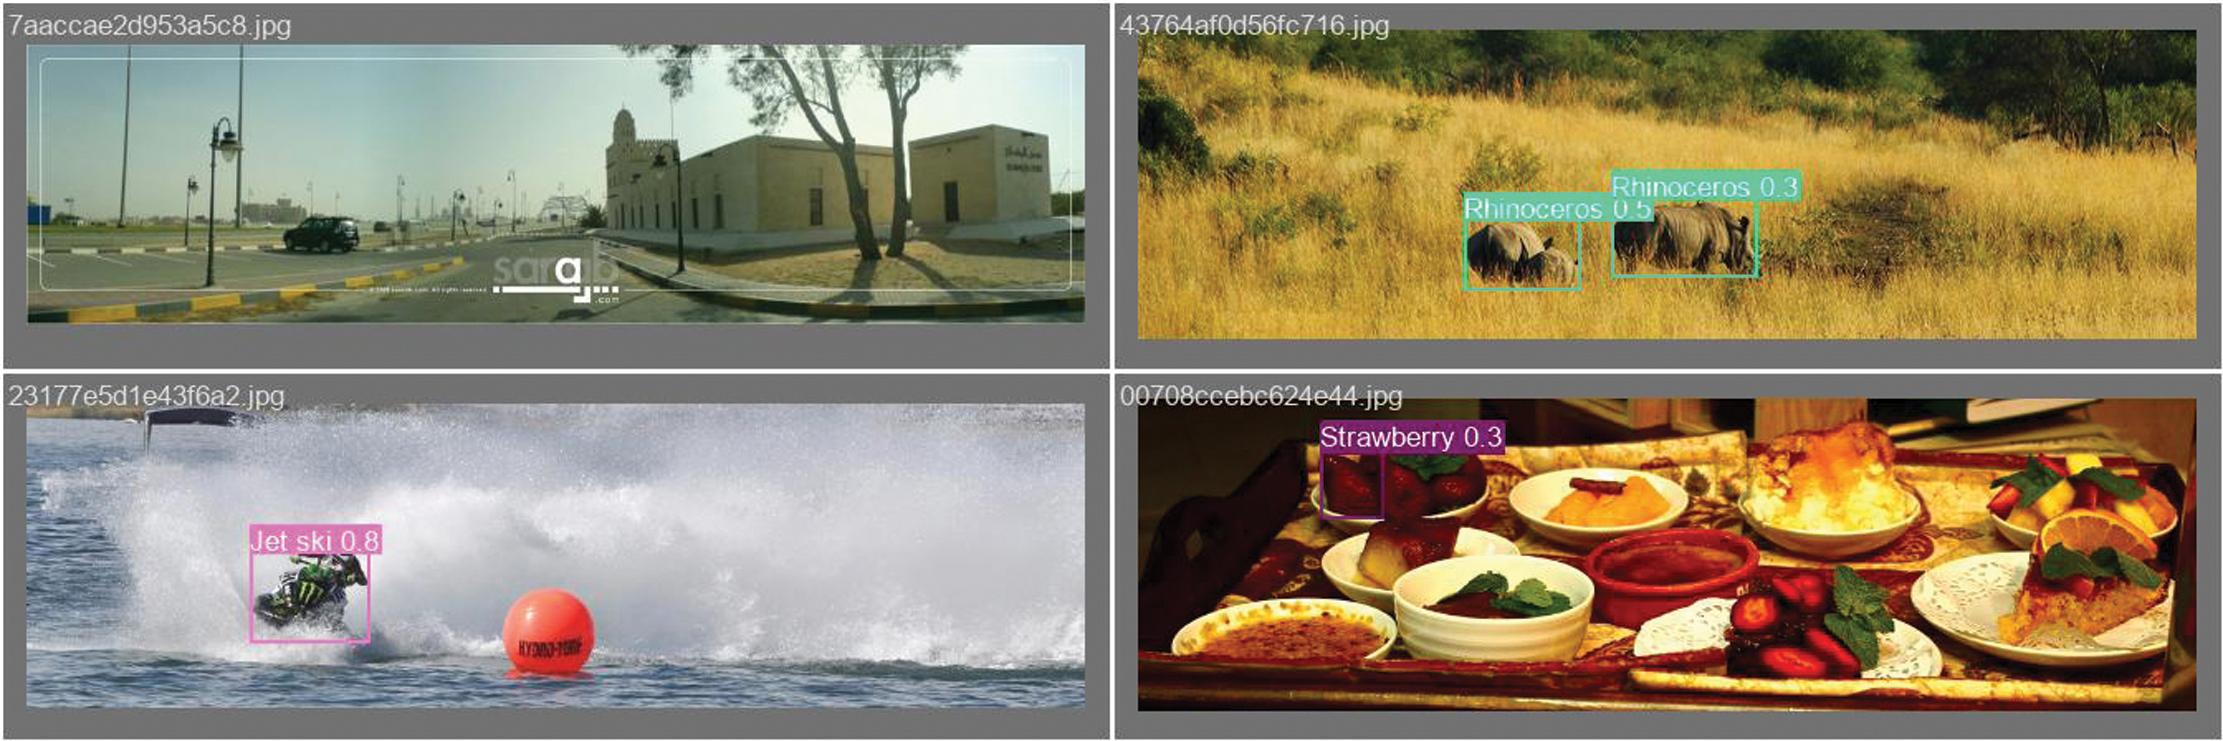 Fig. 18. Validation Batch Predictions for YOLOv11-m variant. Source images are from the Google Open Images dataset, the model generated predictions.
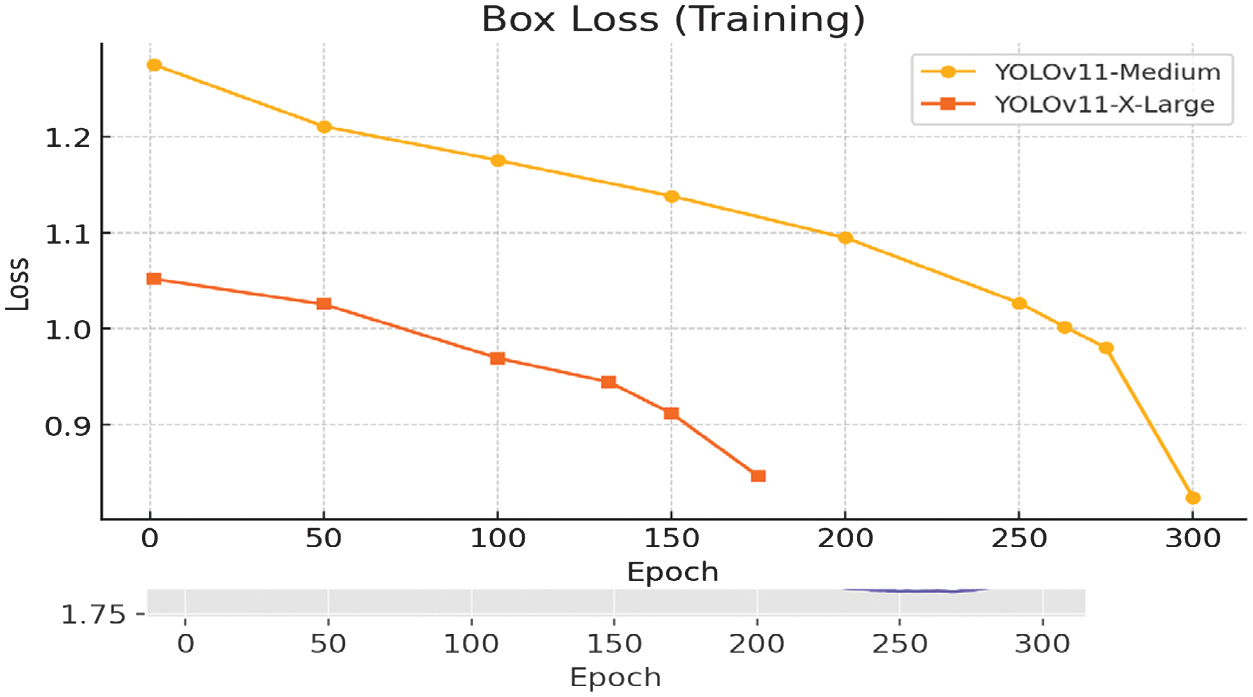 Fig. 19. Training box-loss metric for YOLOv11m/x-large variant.
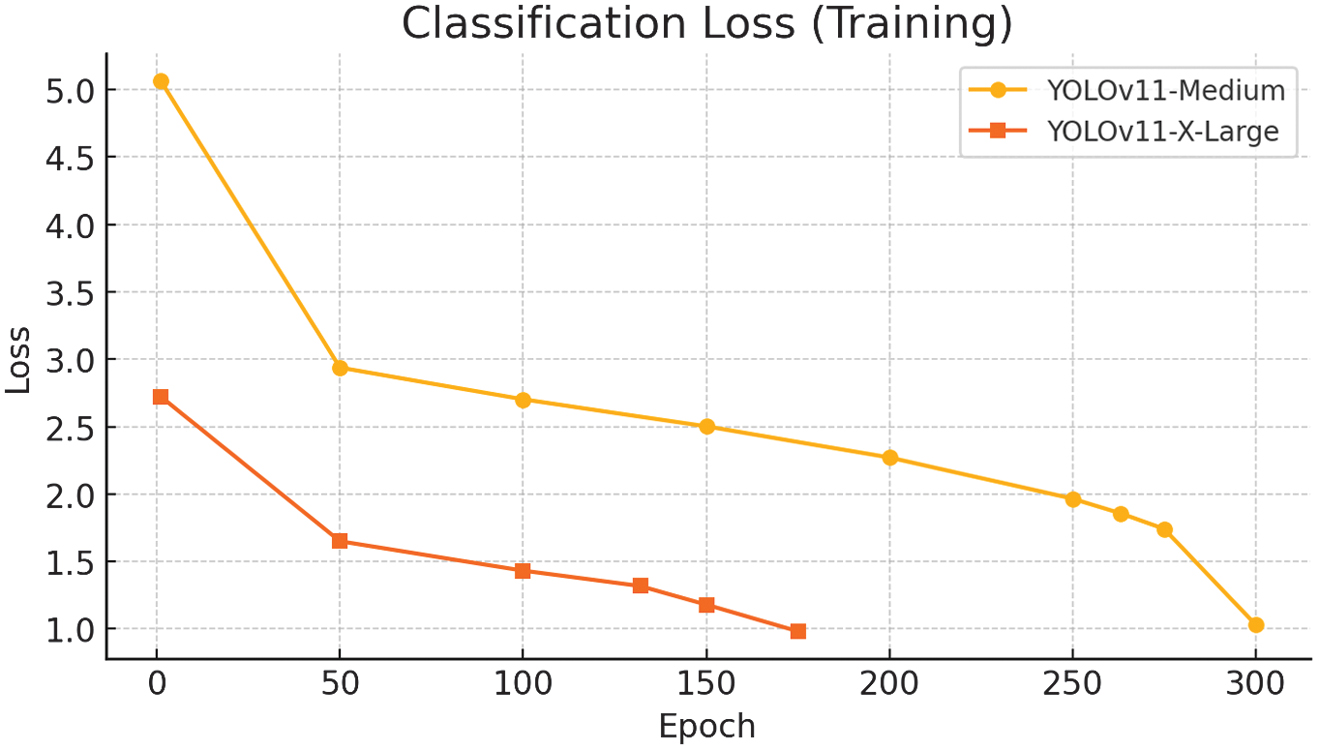 Fig. 20. Training classification loss metric for YOLOv11m/x-large.
In contrast to the ISADS version, this paper includes expanded analysis of detection behavior, incorporating class-wise performance disparities and spatial annotation patterns. These analyses are presented alongside updated metrics and training curves, providing a more complete picture of the model’s strengths, limitations, and readiness for deployment in assistive contexts.
The model achieved a peak mAP@0.5 of 0.578, indicating that, on average, 57.8% of the objects in the validation set were correctly detected with at least 50% IoU between the predicted and ground truth bounding boxes. In practical terms, this means that for every 100 objects present, the model correctly identified approximately 58 with sufficient localization accuracy, while the remaining 42 were either missed entirely or detected with insufficient overlap.
This trend is illustrated in Fig. 21, which shows a steady increase in mAP@0.5 throughout training, peaking at epoch 132 before exhibiting signs of performance decline due to overfitting. The corresponding mAP@0.5–0.95 curve, shown in Fig. 22, plateaued at 0.451, reflecting the model’s effectiveness across stricter IoU thresholds. Together, these values confirm improved detection precision over the medium variant but also highlight the model’s limitations in consistently detecting smaller or ambiguous objects.
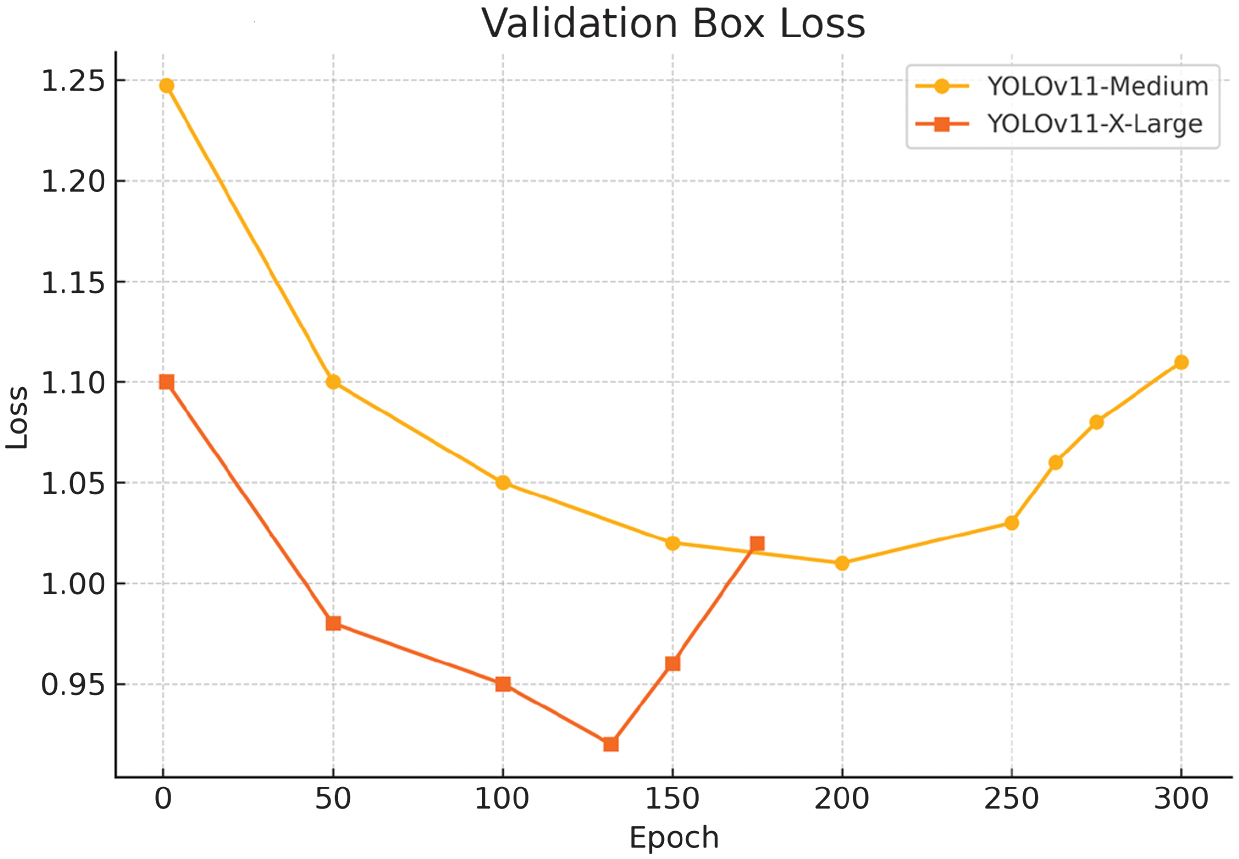 Fig. 21. Validation box loss metric for YOLOv11m/x-large.
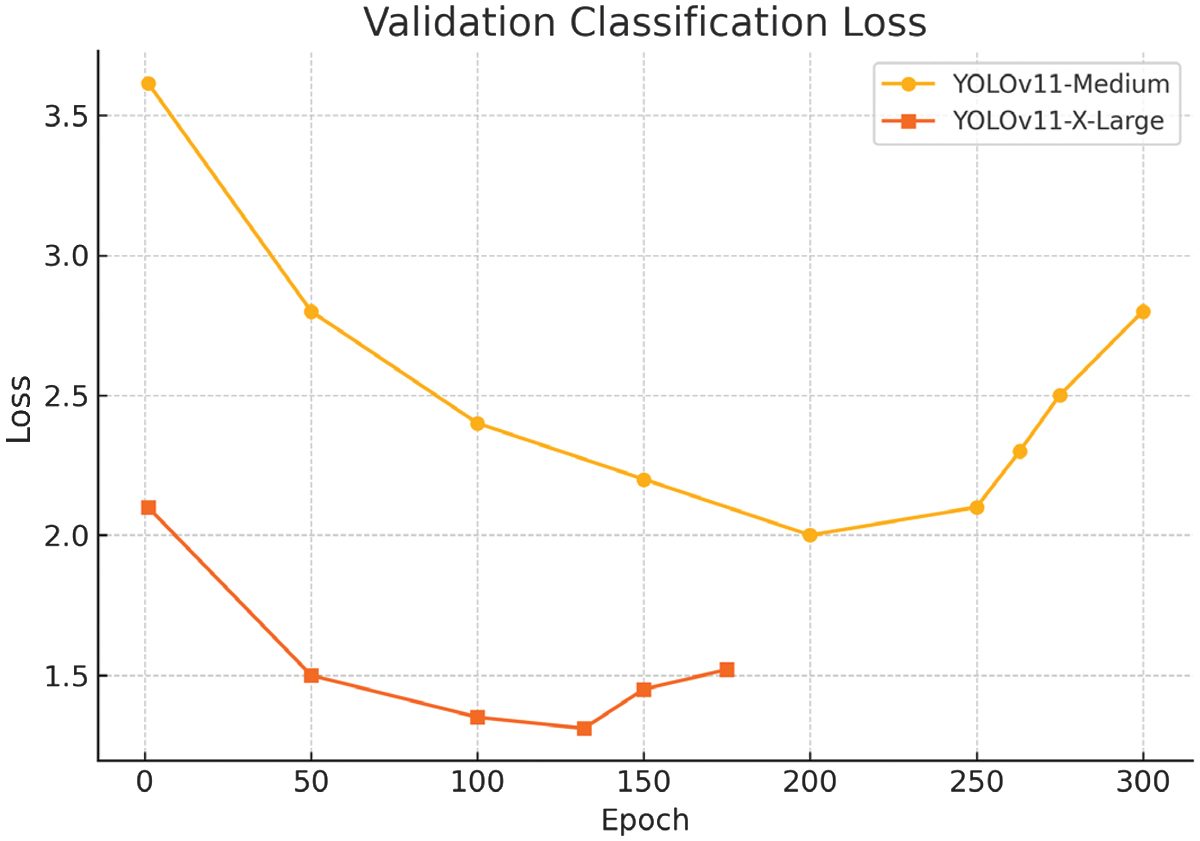 Fig. 22. Validation classification loss metric for YOLOv11m/x-large.
Precision was measured at 0.549, indicating that 54.9% of the predicted bounding boxes correctly matched actual objects, reflecting a reduction in false positives. As shown in Fig. 23, precision steadily improved across training epochs, with a peak near epoch 132 before stabilizing.
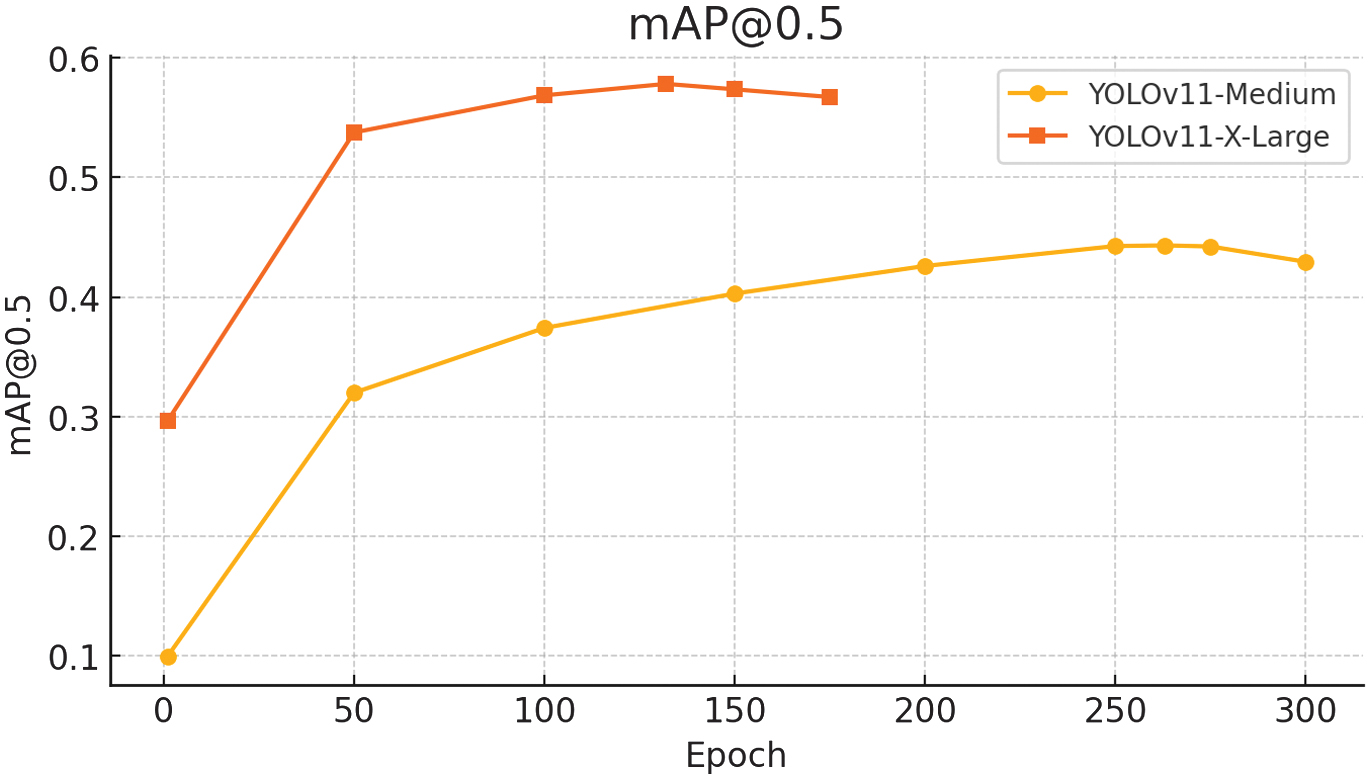 Fig. 23. mAP50 for YOLOv11m/x-large.
Recall increased to 0.603, meaning the model successfully detected 60.3% of all ground truth objects in the validation set. Fig. 24 illustrates this trend, with recall rising rapidly in early epochs and then gradually tapering, highlighting the model’s improved sensitivity to object presence.
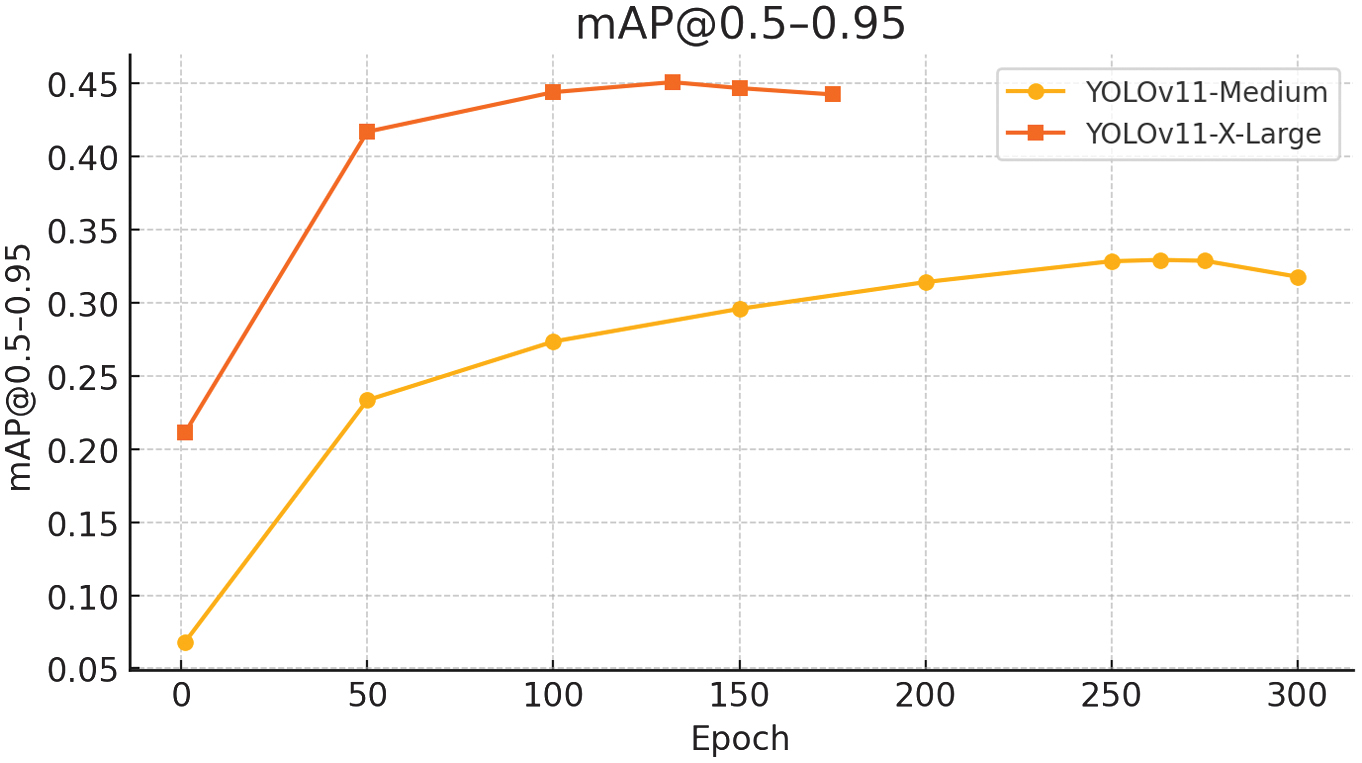 Fig. 24. mAP50-95 for YOLOv11m/x-large.
The model’s F1 Score peaked at 0.56, indicating an effective balance between precision and recall. As shown in the F1 confidence curve, this optimal value was achieved at a confidence threshold of 0.291, suggesting that this point offers the best trade-off between identifying true positives and minimizing false detections.
As shown in the precision–confidence curve (Fig. 26), the model achieved a precision of 1.00 at a confidence threshold of 1.000, indicating that all predictions made at this level were correct. However, such high precision comes at the expense of recall, as the model becomes overly selective and may fail to detect many true objects. This trade-off highlights the importance of tuning confidence thresholds based on application-specific priorities, such as minimizing false positives versus maximizing object coverage.
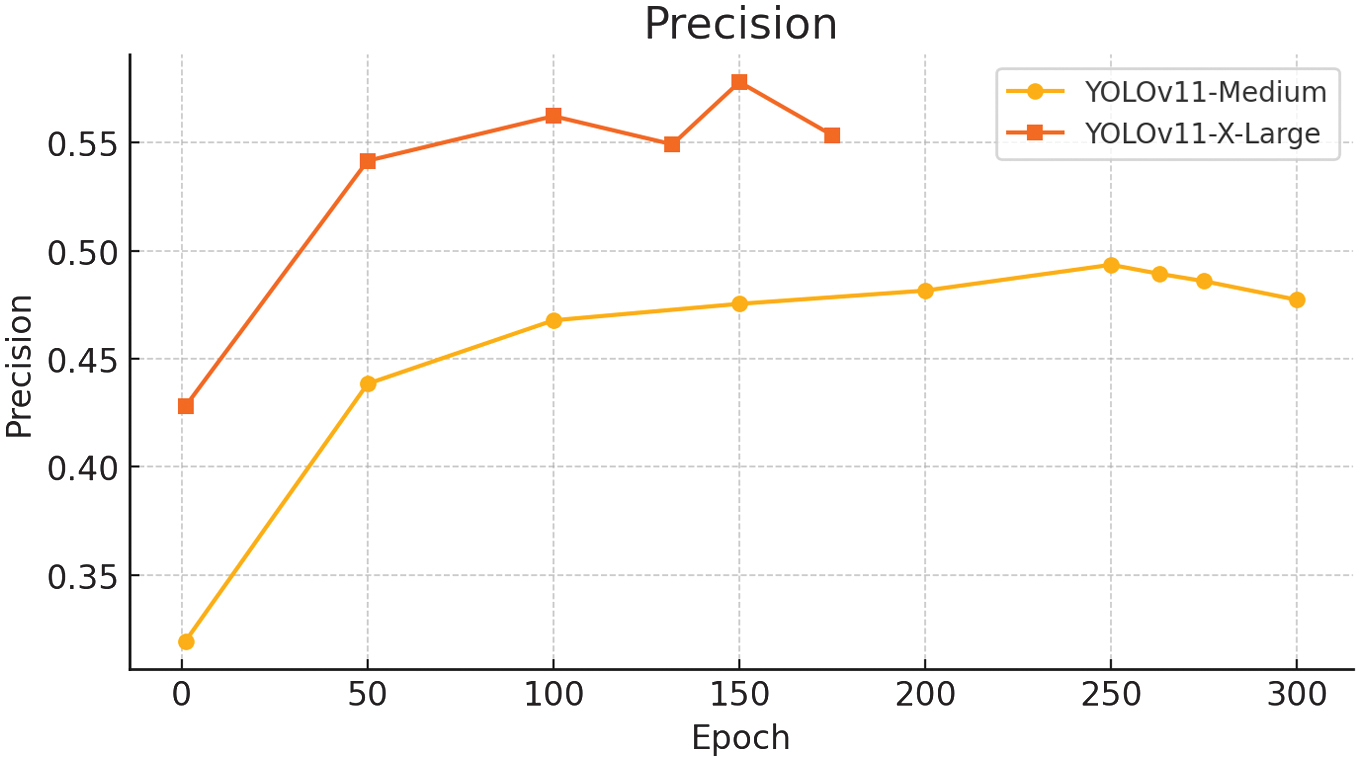 Fig. 25. Precision for YOLOv11m/x-large.
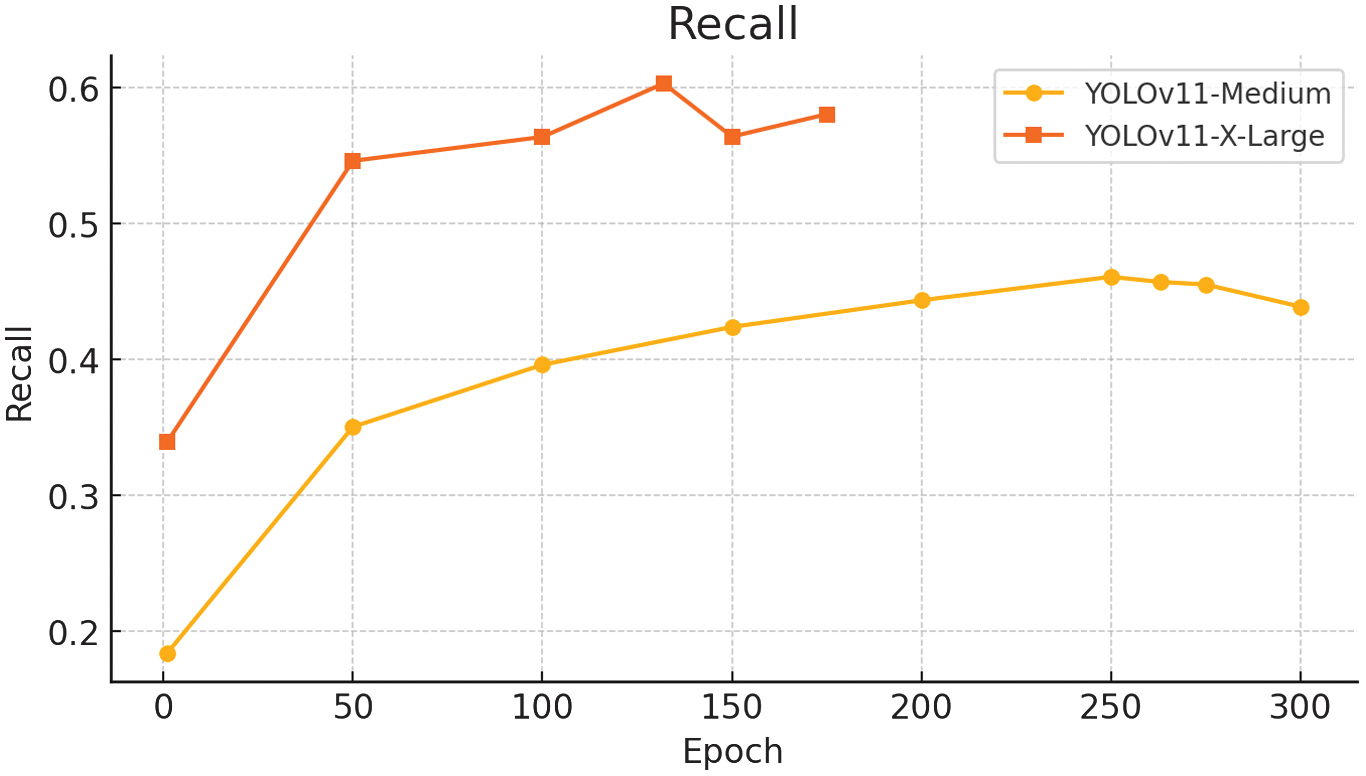 Fig. 26. Recall for YOLOv11m/x-large.
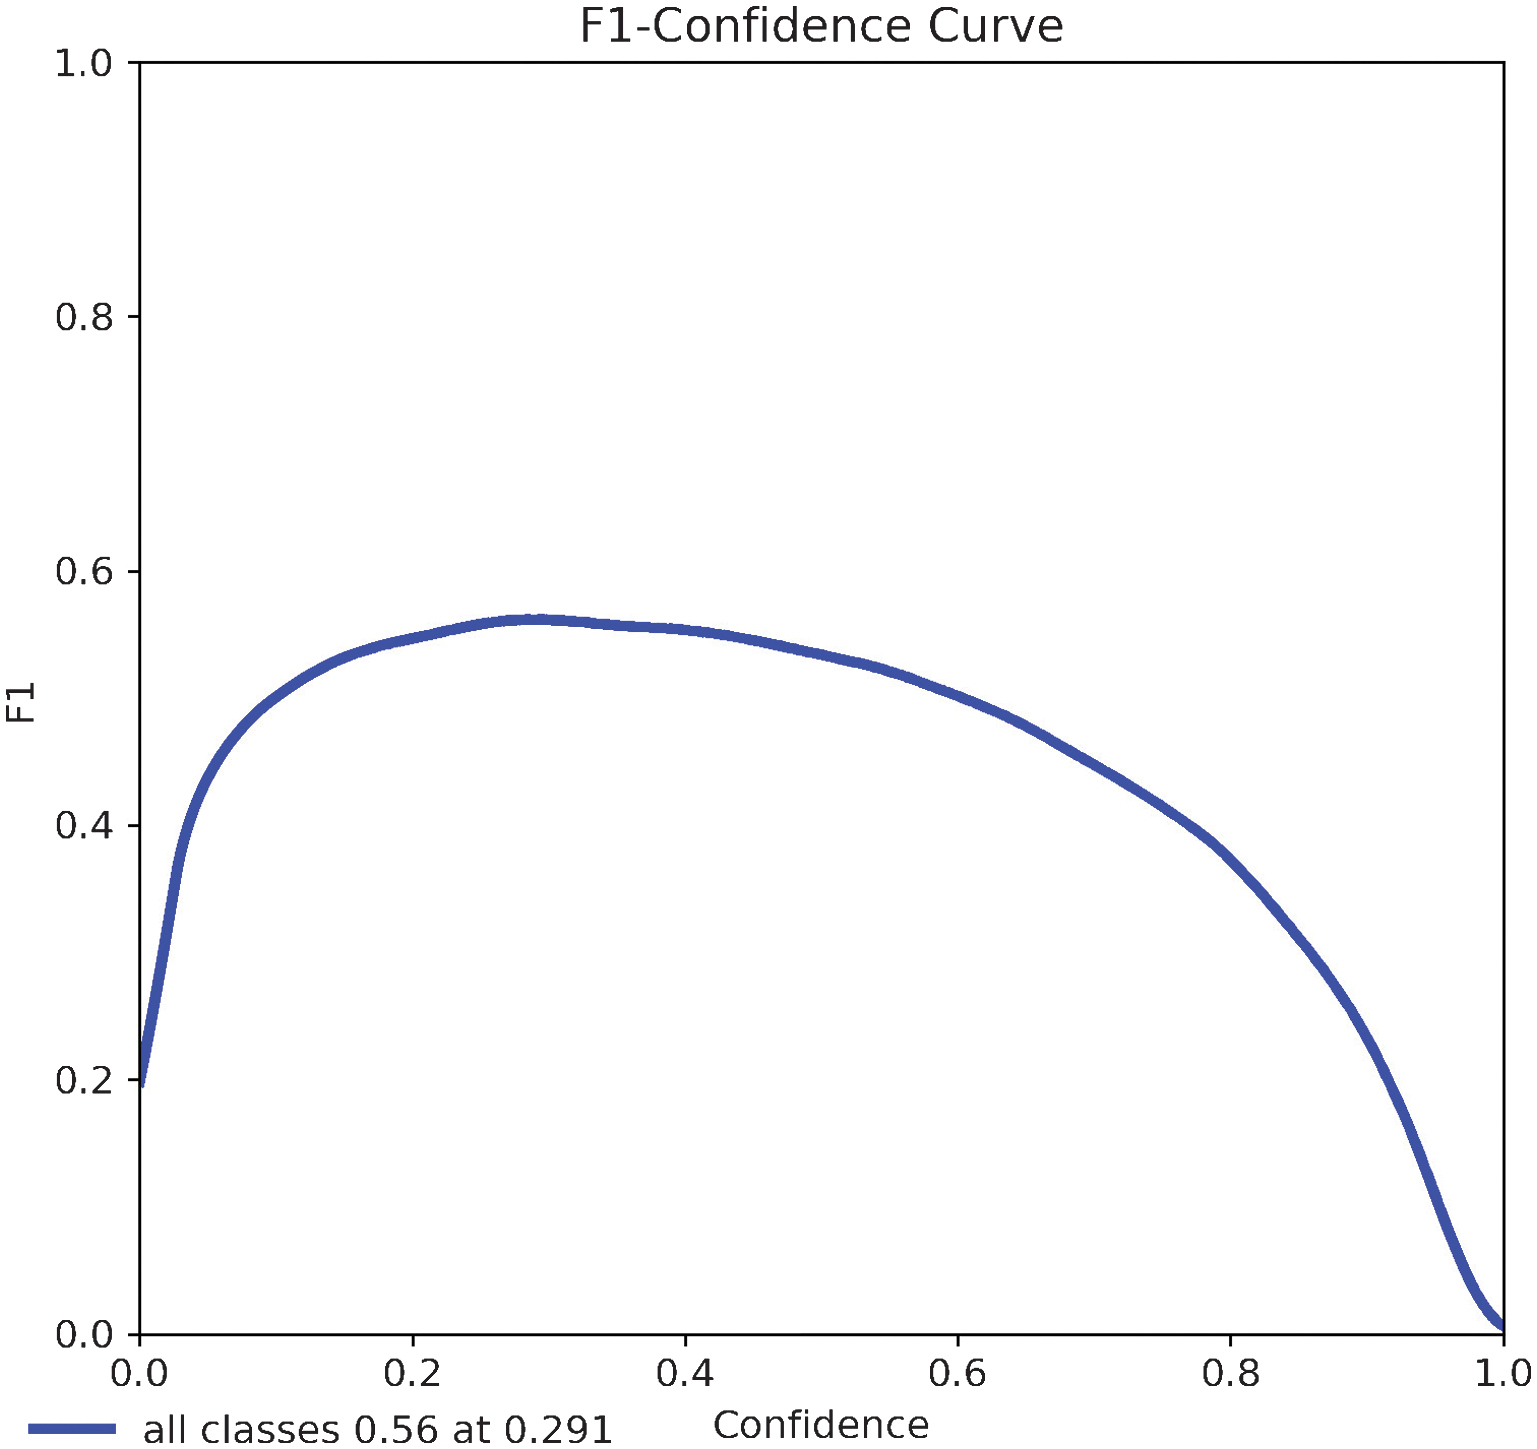 Fig. 27. F1 score for YOLOv11 x-large.
The precision–recall curve indicates that the model achieved a mean average precision at an IoU threshold of 0.50 (mAP@0.5) of 0.578. This value reflects the average precision across all recall levels, providing a summary of the model’s ability to correctly identify objects with at least 50% overlap between predicted and ground truth bounding boxes. A higher mAP@0.5 denotes stronger overall detection performance and indicates greater reliability in localizing and classifying objects under standard evaluation conditions.
The recall–confidence curve (Fig. 28) demonstrates that recall tends to decrease as the confidence threshold increases, reflecting the model’s increasing conservatism in making predictions. The model casts a wider net at lower thresholds, detecting more objects but with less certainty. In this case, the model achieved a maximum recall of 0.88 at a confidence threshold of 0.000, meaning it successfully identified 88% of all objects when operating without confidence-based filtering. This curve is valuable for selecting an optimal threshold that balances high recall with acceptable precision, depending on the application’s sensitivity to missed detections.
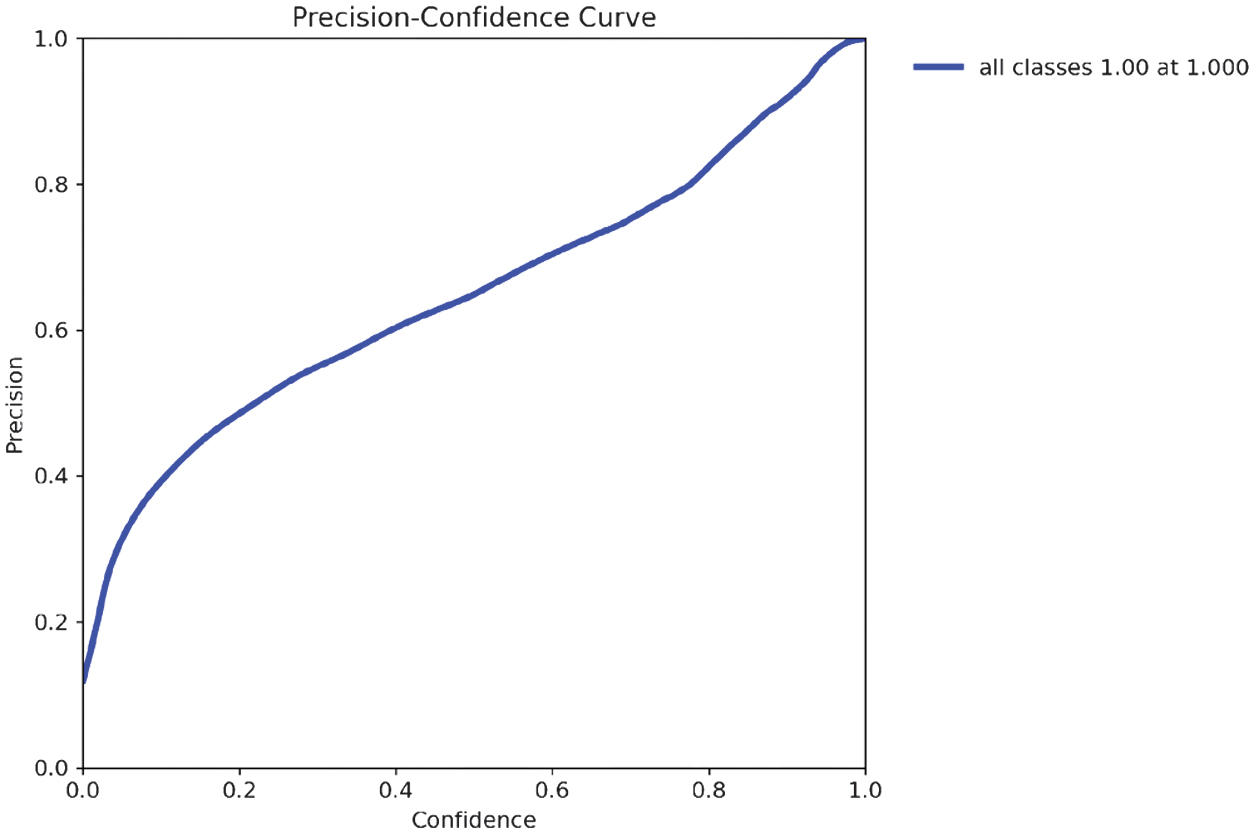 Fig. 28. Precision Curve for YOLOv11-X-Large variant.
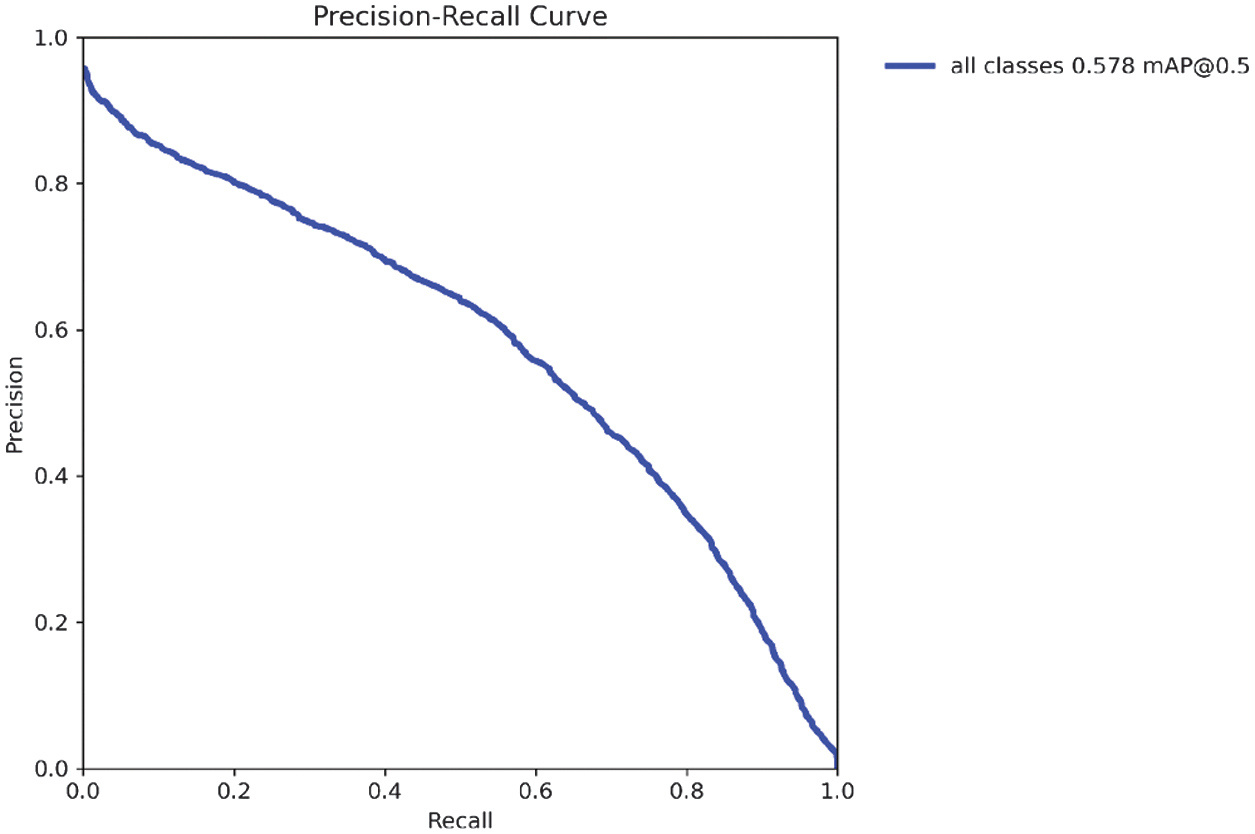 Fig. 29. Precision-Recall Curve for YOLOv11-X-Large variant.
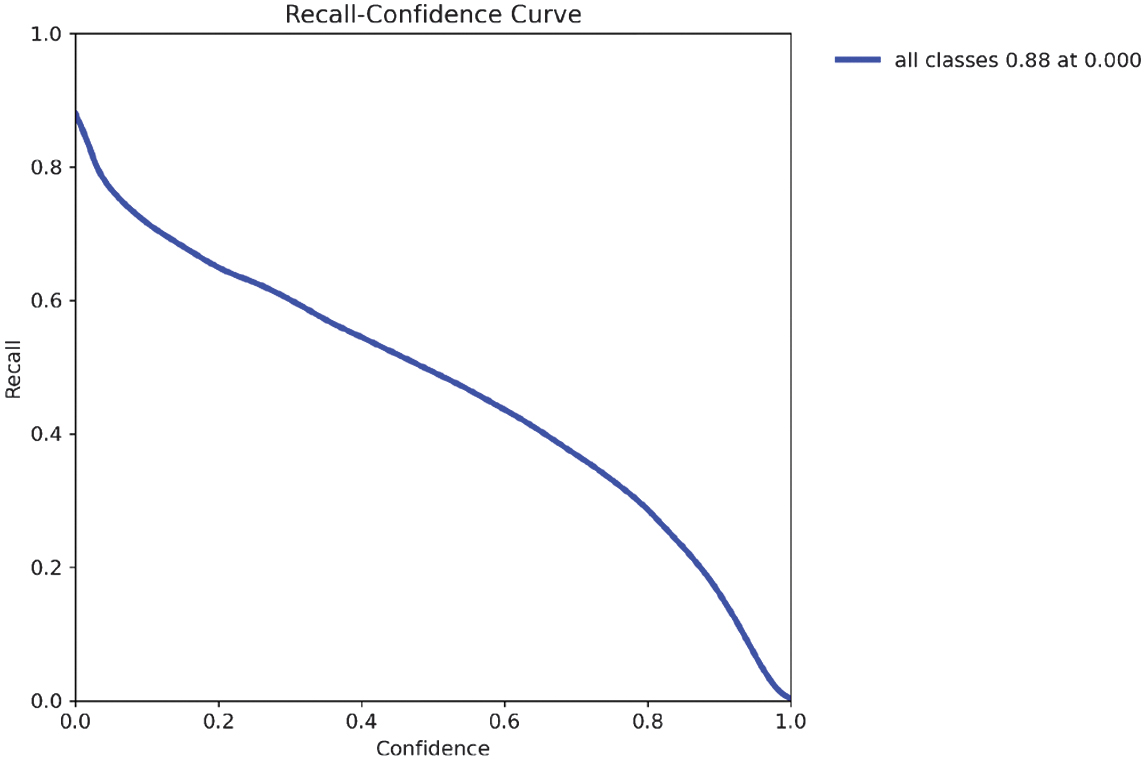 Fig. 30. Recall Curve for YOLOv11-X-Large variant.
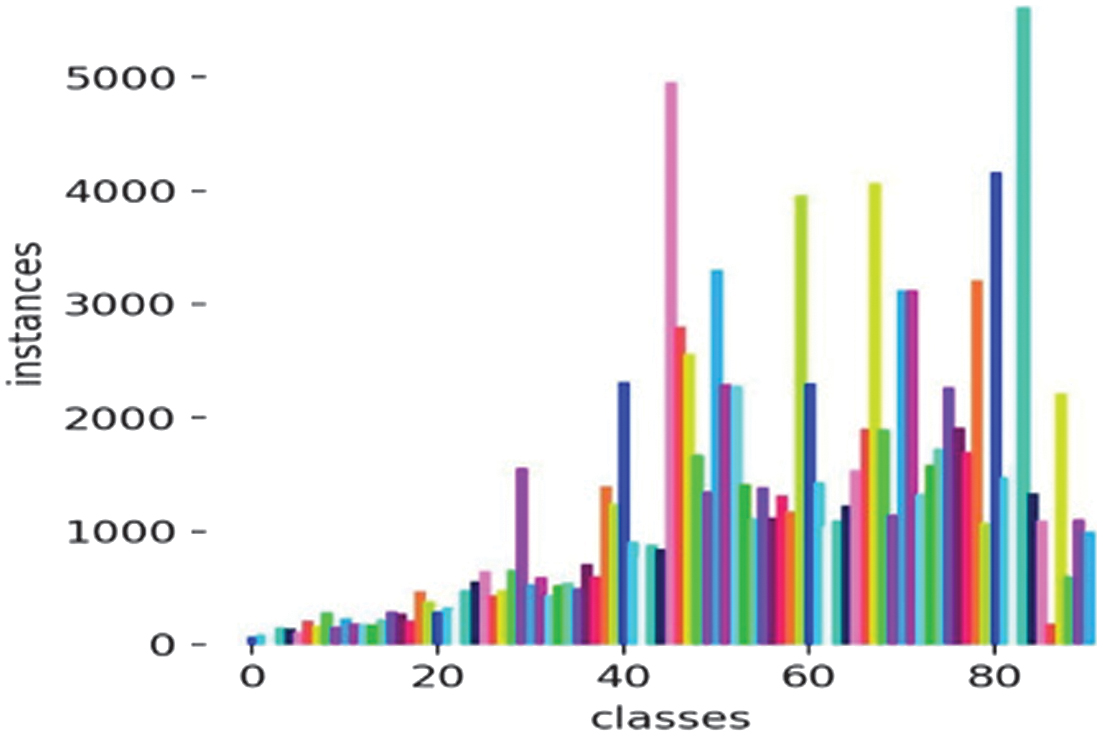 Fig. 31. Class imbalance for YOLOv11-X-Large variant.
The model also shows that the class distribution is imbalanced, as some classes have up to 5500 instances while others are close to zero. This will result in the model performing well in overrepresented classes but poorly in underrepresented ones.
The labels correlogram: In my model, the width and height are primarily small, which means that most of my objects in the dataset are small. The x and y are centered around 0.5, meaning the objects are often located near the image center. If the dataset lacks objects near the edges, the model might struggle to detect them in those areas.
(width, height): Appears skewed, meaning that small width values dominate, and the model might struggle to detect larger objects properly.
(x, height) shows objects near the center in the x-axis (x ≈ 0.5) tend to be taller, while objects closer to the edges (x ≈ 0 or x ≈ 1) are shorter.
(y, width) & (x, height): Show mirrored patterns of the x-y relationship. (y, width) shows that objects near the center in the y-axis (x ≈0.5) tend to have larger widths while objects closer the top (y ≈ 1) or bottom (y ≈0) are narrower, which suggests spatial correlation where objects’ width changes depending on y-position.
(x, y) form a cross-like shape suggesting a central concentration of data.
While (x, width) and (y, height) show a triangle distribution indicating a dependency, objects near the center tend to have larger bounding boxes, for example, when width decreases and x moves away from the center. The model might expect bigger objects in the center and struggle with detecting smaller objects.
Scaling to YOLOv11 X-Large and balancing classes yielded 13.5 % higher mAP and 14.6 % better recall, validating the methodological improvement in dataset curation and architectural scaling.
Several key observations emerged from the evaluation. During training, all core loss components—box loss, classification loss, and DFL—continued to decrease, indicating that the model was effectively minimizing prediction errors on the training set. The mAP@0.5 reached its peak value of 0.578 at epoch 132.
However, beyond this point, mAP@0.5 began to decline, suggesting that while training loss continued to improve, validation performance started to degrade. This divergence is a strong indicator of overfitting and suggests that extending training beyond the peak epoch may negatively impact the model’s generalization ability.
The evaluation for the X-Large variant is further demonstrated through validation batch labels and predictions (Figs. 32 and 33).
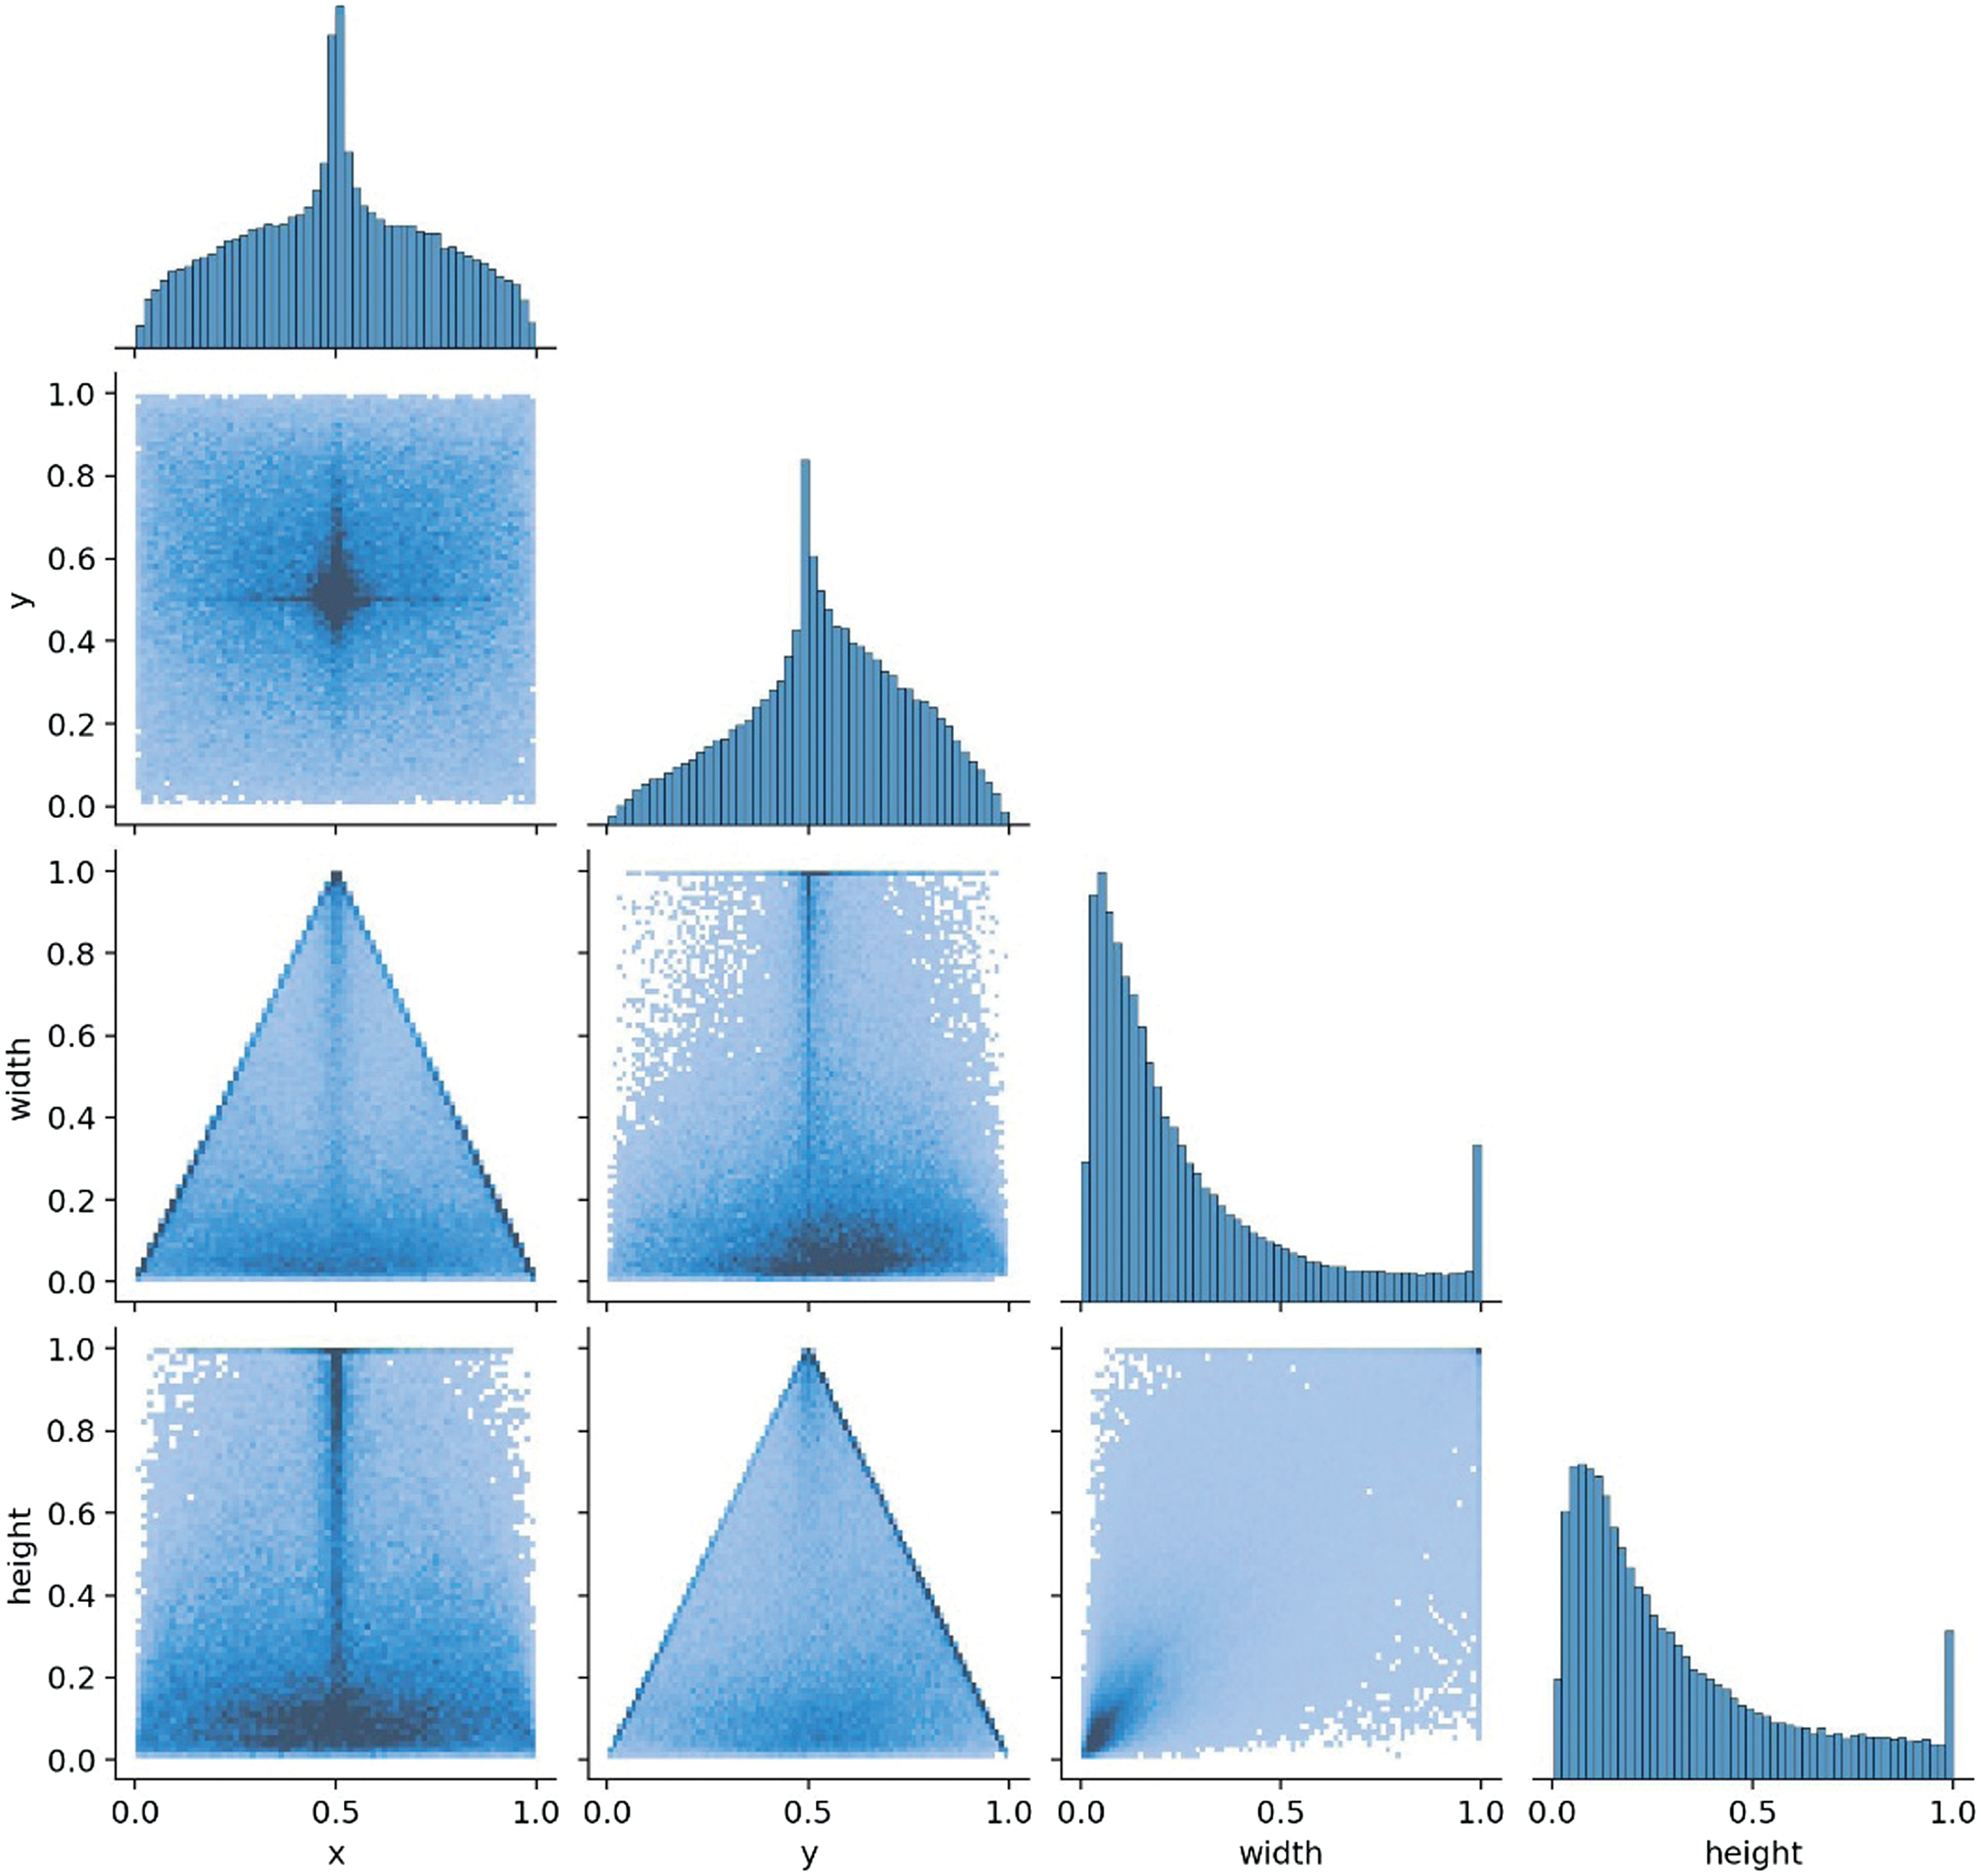 Fig. 32. Labels correlogram for YOLOv11-X-Large variant.
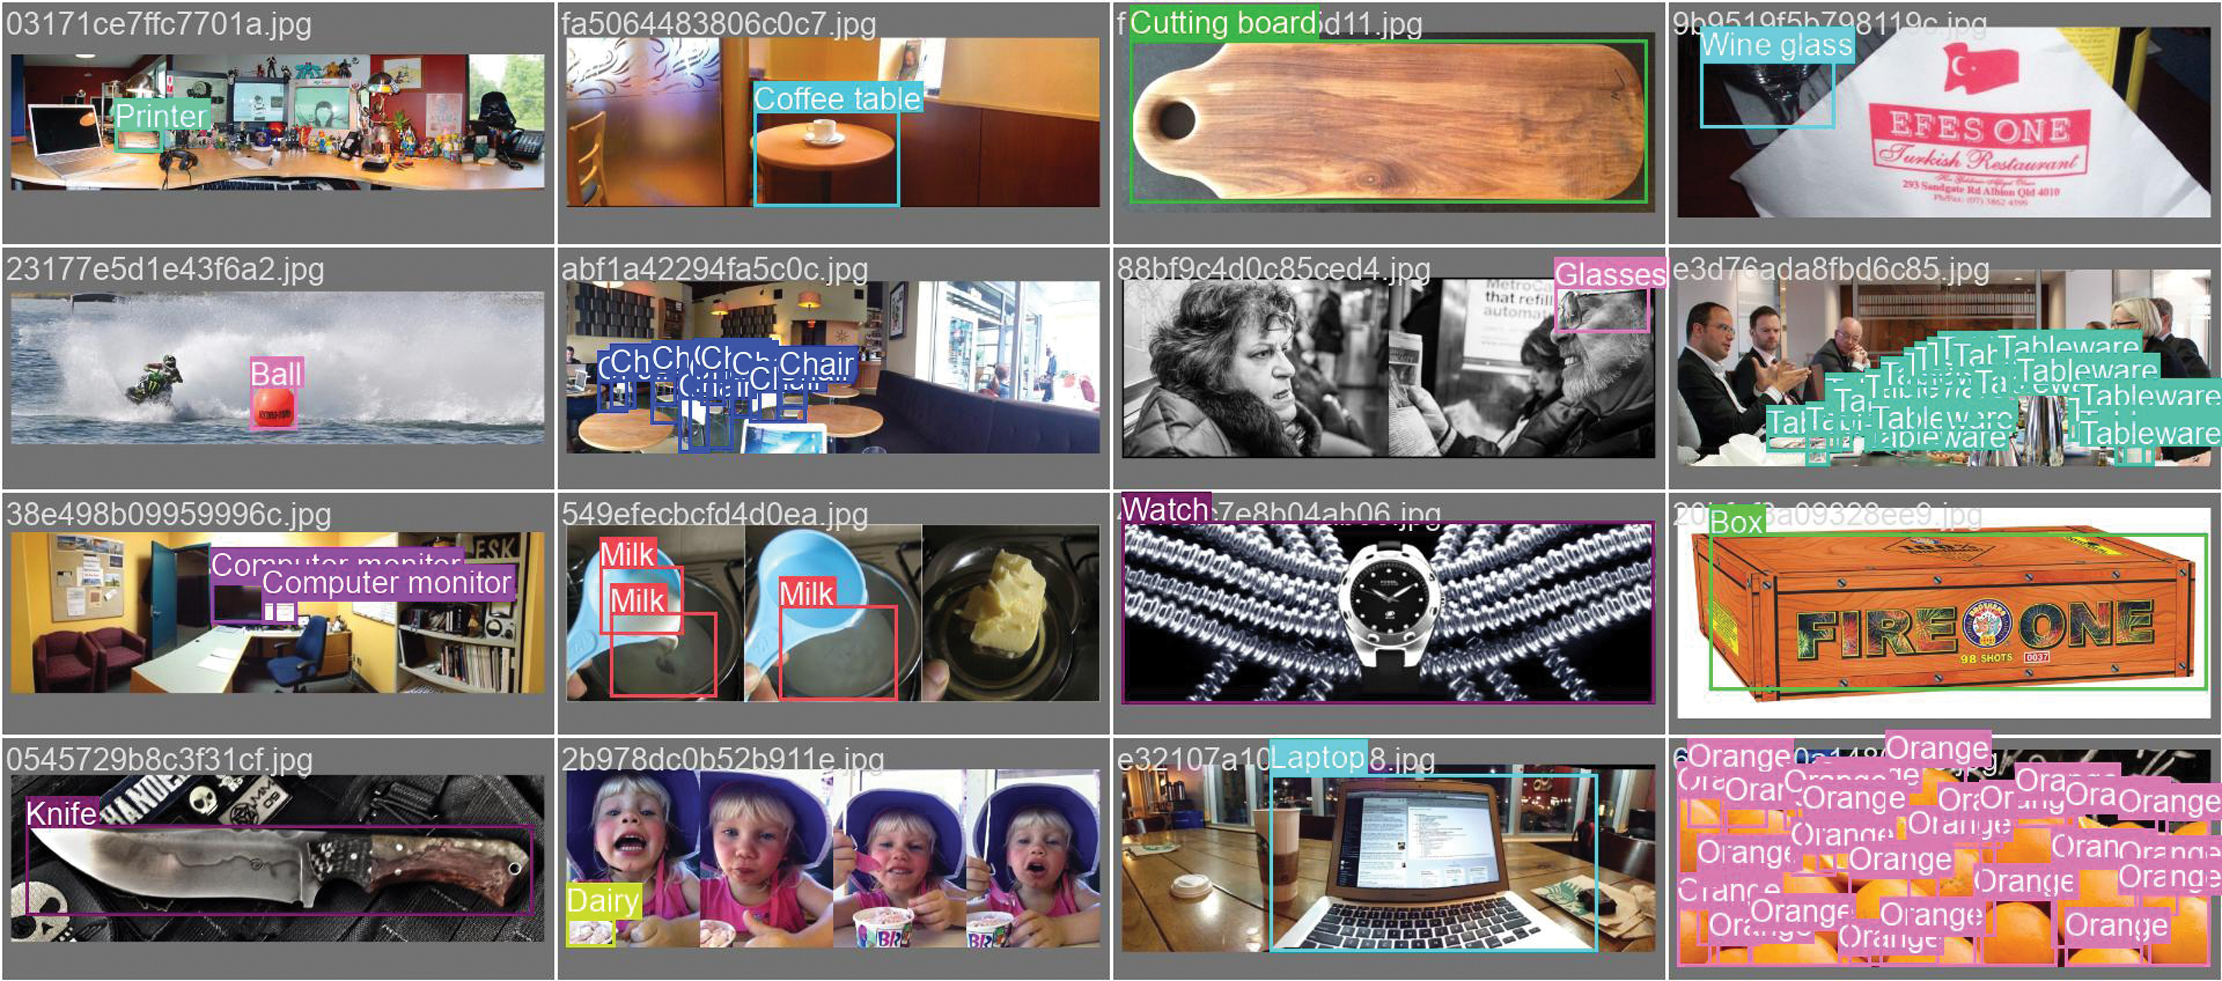 Fig. 33. Validation Batch Labels for YOLOv11-X-Large variant. Source images are from the Google Open Images dataset, which shows actual annotations for images.
A comparison between the retrained YOLOv11 X-Large model and the initial YOLOv11 Medium variant highlights several key improvements. The mAP@0.5 increased from 0.443 to 0.578, reflecting a significant gain in object detection accuracy.
Similarly, recall improved from 0.457 to 0.603, indicating the model’s enhanced ability to detect a higher proportion of true objects. These gains are attributed to a more balanced and focused dataset, increased image resolution (768 PX), and more powerful architecture with optimized training configurations.
The larger image size contributed to finer bounding box predictions, and the class balancing improved consistency across object categories. However, overfitting emerged beyond epoch 132, where training losses continued to decline while validation metrics began to plateau or deteriorate. This divergence suggests the need for stronger regularization or early stopping techniques in future iterations. Overall, the results confirm that scaling up model capacity and improving data quality can substantially enhance detection performance, though careful tuning remains essential to generalization.
IV.EXPERIMENT RESULTS AND ANALYSIS
This section presents a detailed performance comparison between the YOLOv11 Medium and YOLOv11 X-Large models, followed by an evaluation of how OWL-ViT [9] enhances the My Eye AI detection pipeline. Fig. 34 shows the process of OWL-ViT integration for open vocabulary detection.
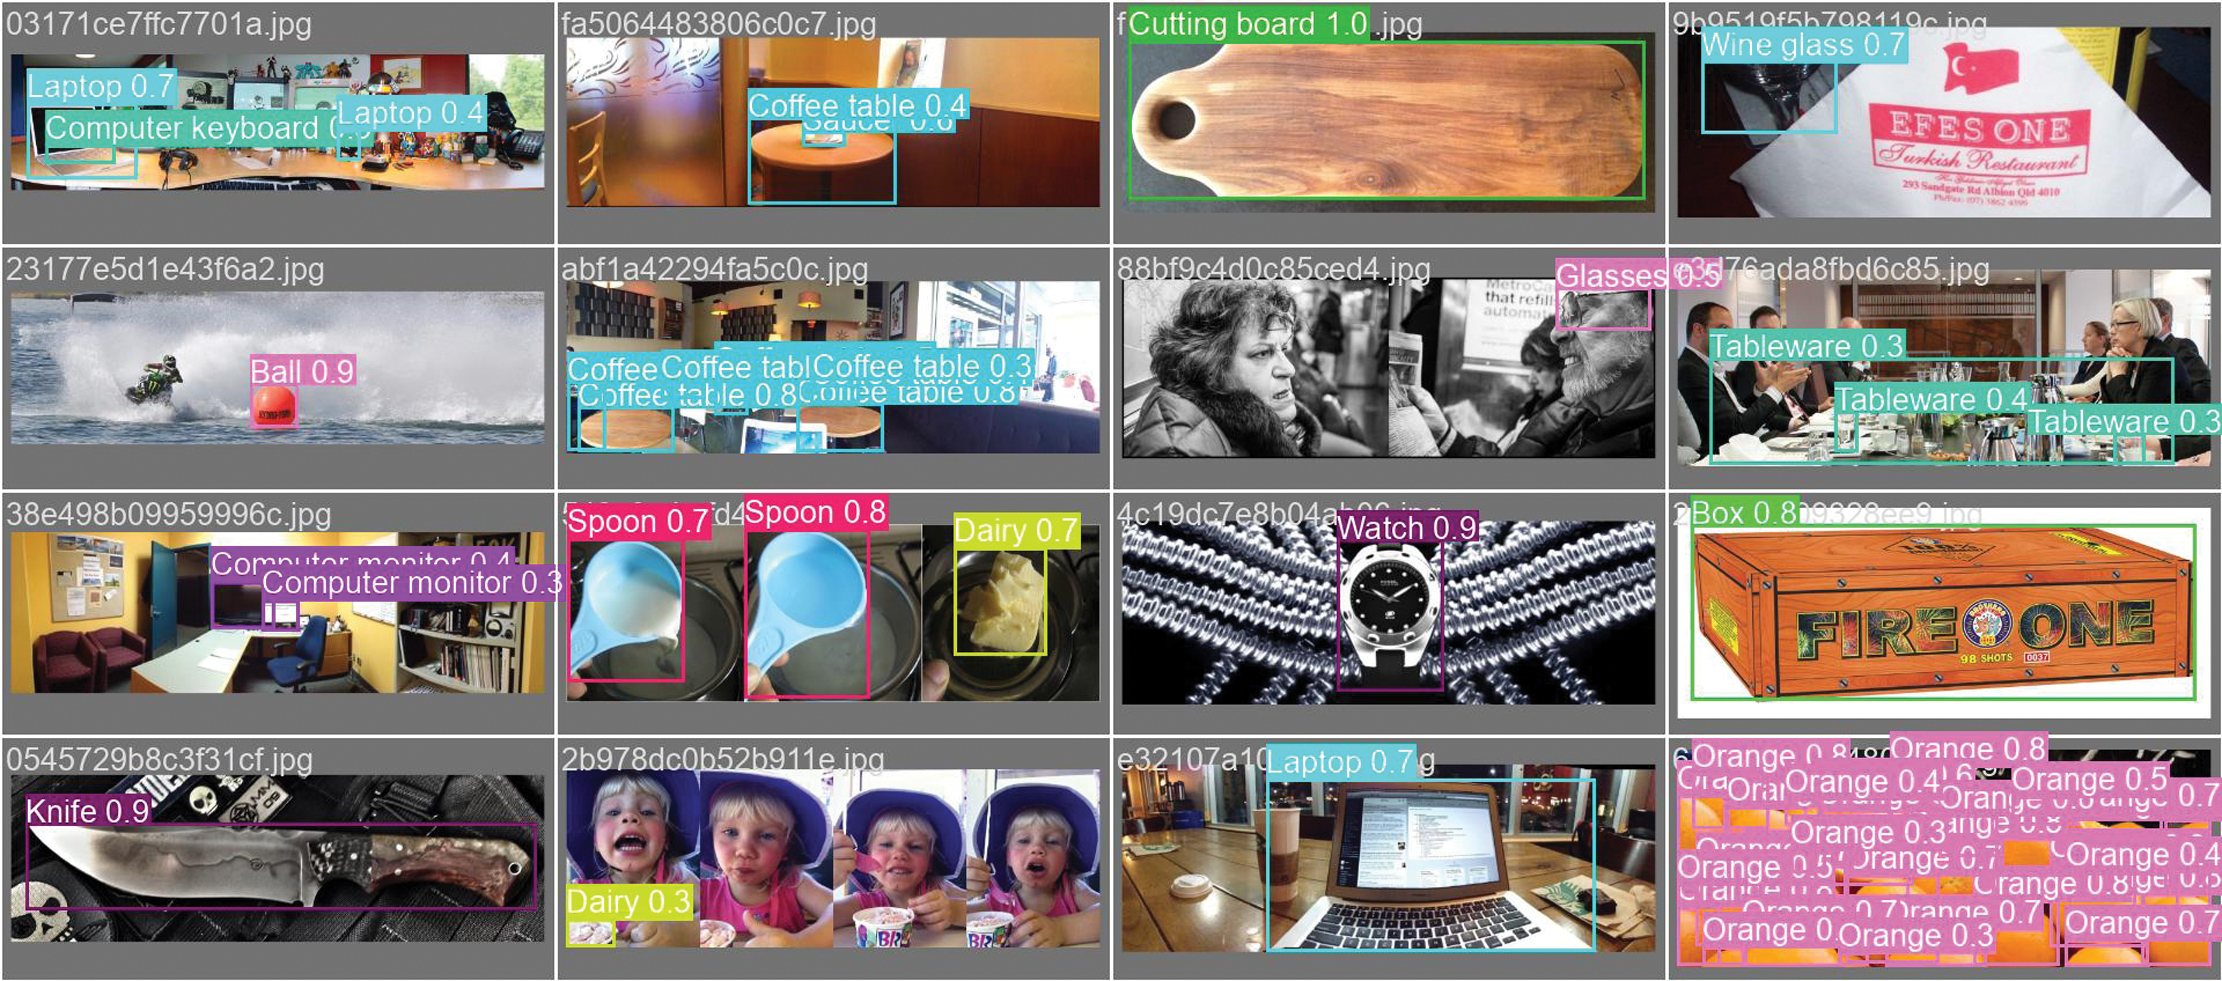 Fig. 34. validation batch predictions for the YOLOv11-X-Large variant. Source images are from the Google Open Images dataset, the model generated predictions.
A.YOLOv11 MEDIUM VS. X-LARGE: COMPARATIVE ANALYSIS
1).DETECTION ACCURACY: MAP@0.5 AND MAP@0.5–0.95
The mean average precision (mAP) [25] across varying intersection-over-union (IoU) thresholds measure the models’ overall detection accuracy:
YOLOv11 Medium: mAP50 = 0.443, mAP50-95 = 0.329
YOLOv11 X-Large: mAP50 = 0.578, mAP50-95 = 0.451
Key Finding: The X-Large variant significantly outperformed the Medium model, achieving a 13.5% improvement in mAP@0.5 and a 12.2% gain in mAP@0.5–0.95, highlighting its stronger object localization and recognition capability across varying IoU thresholds.
2).PRECISION-RECALL TRADE-OFF AND F1 SCORE [24]
YOLOv11 Medium: Precision = 0.489, Recall = 0.457, F1 Score =0.43
YOLOV11 X-Large: Precision = 0.549, Recall = 0.603, F1 Score = 0.56
Key Finding: The increase in F1 score from 0.43 to 0.56 demonstrates a better balance between precision and recall in the X-Large model. This balance enhances real-world object detection, reducing both false positives and false negatives.
3).OVERFITTING BEHAVIOR AND GENERALIZATION
YOLOv11 Medium: Validation loss began to increase after epoch 263, indicating the onset of overfitting, where the model started memorizing training data rather than generalizing.
YOLOv11 X-Large: Overfitting was observed earlier at epoch 132, likely due to the model’s higher capacity. However, the effects were less severe, owing to a more balanced dataset and improved data augmentation strategies.
Key Finding: Despite both models exhibiting signs of overfitting, YOLOv11 X-Large demonstrated better generalization, with stronger performance on unseen data and reduced premature convergence.
B.OWL-ViT’S CONTRIBUTION TO OPEN-VOCABULARY DETECTION
One limitation of conventional YOLO-based models is that they are restricted to detecting objects within a fixed set of predefined training categories. This constraint reduces flexibility in dynamic, real-world environments where users may refer to objects not seen during training. To overcome this, My Eye AI integrates OWL-ViT (Open-World Learning Vision Transformer), which enables zero-shot object detection using natural language prompts.
Integrating OWL-ViT introduced open-vocabulary capability, a methodological expansion beyond fixed-class detection, strengthening the system’s adaptability.
Unlike YOLOv11, which relies on hard-coded class labels, OWL-ViT supports open-vocabulary detection, allowing users to make object queries using natural phrases such as “Do you see my keys?.” OWL-ViT converts the input query into a text embedding and compares it with image regions to locate objects that were not explicitly annotated or trained in the YOLO pipeline.
1).EXPERIMENTAL EVALUATION
OWL-ViT was evaluated in two testing scenarios:
- •Known Object Detection: When evaluating known object classes already included in the YOLOv11 training set, the system defaulted to YOLO’s prediction, and OWL-ViT was not needed.
- •Unknown Object Detection: For object categories not present in the YOLO training data, OWL-ViT successfully identified the target in 71.4% of test cases using zero-shot inference and natural language descriptions.
Key Finding: OWL-ViT significantly extended My Eye AI’s detection capabilities, achieving 71.4% accuracy in detecting objects outside YOLOv11’s known categories. This demonstrates its effectiveness in open-world applications, where adaptability to new or user-defined object classes is critical for real-world deployment [9].
C.CONFUSION MATRIX AND ERROR ANALYSIS
To further understand detection behavior and category-level performance, confusion matrices [26] were generated for both the YOLOv11 Medium and X-Large models. These matrices visualize class-level predictions and misclassifications, providing insights into how frequently objects were correctly identified versus misclassified or missed entirely.
To quantify the results, Table III presents the true positives (TP), false positives (FP), and false negatives (FN) for each model. These metrics reveal how accurately the models detected the correct classes and how often they produced incorrect or missed predictions.
Table I. Epoch-wise training loss and evaluation metrics for object detection (YOLO-m variant Model)
| Epoch | Time | Train/ | Train/ | Train/ | Metrics/ | Metrics/ | Metrics/ | Metrics/ |
|---|---|---|---|---|---|---|---|---|
| 6146.05 | 1.27478 | 5.06465 | 1.51807 | 0.31921 | 0.18408 | 0.09948 | 0.06794 | |
| 63956.8 | 1.21053 | 2.93702 | 1.47388 | 0.43841 | 0.35056 | 0.31991 | 0.23344 | |
| 354925 | 1.17524 | 2.7017 | 1.43752 | 0.4678 | 0.39628 | 0.37405 | 0.27355 | |
| 636188 | 1.13809 | 2.50146 | 1.40645 | 0.47544 | 0.4241 | 0.4028 | 0.29592 | |
| 46183.7 | 1.09463 | 2.2708 | 1.36633 | 0.48156 | 0.44372 | 0.42587 | 0.31423 | |
| 236174 | 1.02692 | 1.96605 | 1.31127 | 0.49351 | 0.46099 | 0.4425 | 0.32851 | |
| 372542 | 0.98015 | 1.74214 | 1.27559 | 0.48592 | 0.45535 | 0.44215 | 0.32884 | |
| 503270 | 0.82456 | 1.03199 | 1.16741 | 0.47728 | 0.43904 | 0.42935 | 0.3179 |
Table II. Epoch-wise training loss and evaluation metrics for object detection (YOLO-X-large variant Model)
| Epoch | time | train/ | train/ | train/ | metrics/ | metrics/ | metrics/ | metrics/ |
|---|---|---|---|---|---|---|---|---|
| 1088.4 | 1.05185 | 2.72336 | 1.35631 | 0.42798 | 0.3395 | 0.29622 | 0.21116 | |
| 17273.7 | 1.02547 | 1.64956 | 1.33351 | 0.54167 | 0.54634 | 0.53748 | 0.41707 | |
| 31292.3 | 0.96956 | 1.43168 | 1.28665 | 0.56233 | 0.56392 | 0.56849 | 0.44417 | |
| 40187.4 | 0.91199 | 1.17968 | 1.2327 | 0.57812 | 0.56418 | 0.5735 | 0.44696 | |
| 5061.18 | 0.84656 | 0.98268 | 1.18485 | 0.55348 | 0.58062 | 0.56708 | 0.44261 |
Table III. TP, FP, FN metrics for YOLOv11 (M & X-large Variant)
| Model | True positives | False positives | False negatives |
|---|---|---|---|
| Medium | 45.7% | 51.1% | 54.3% |
| X-Large | 60.3% | 45.1% | 39.7% |
As illustrated in Fig. 35 and 36, confusion matrices capture class-level misclassifications. The corresponding TP, FP, and FN metrics are summarized in Table III.
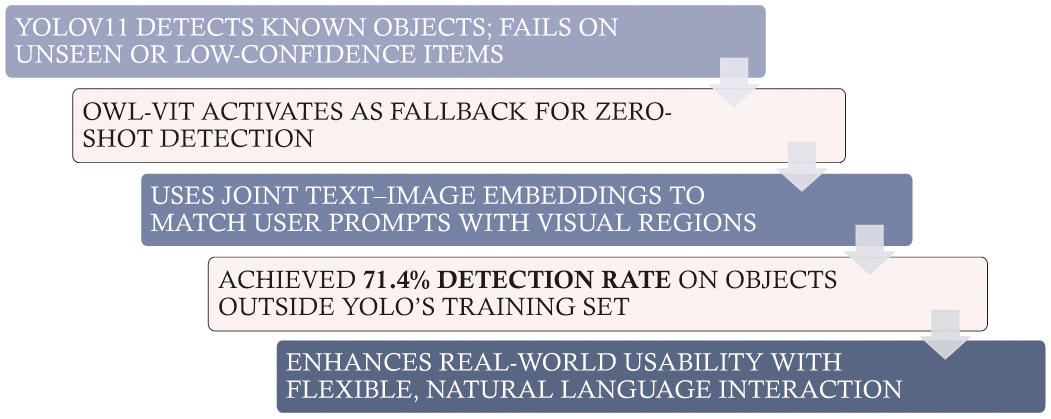 Fig. 35. OWL-ViT integration for open vocabulary detection.
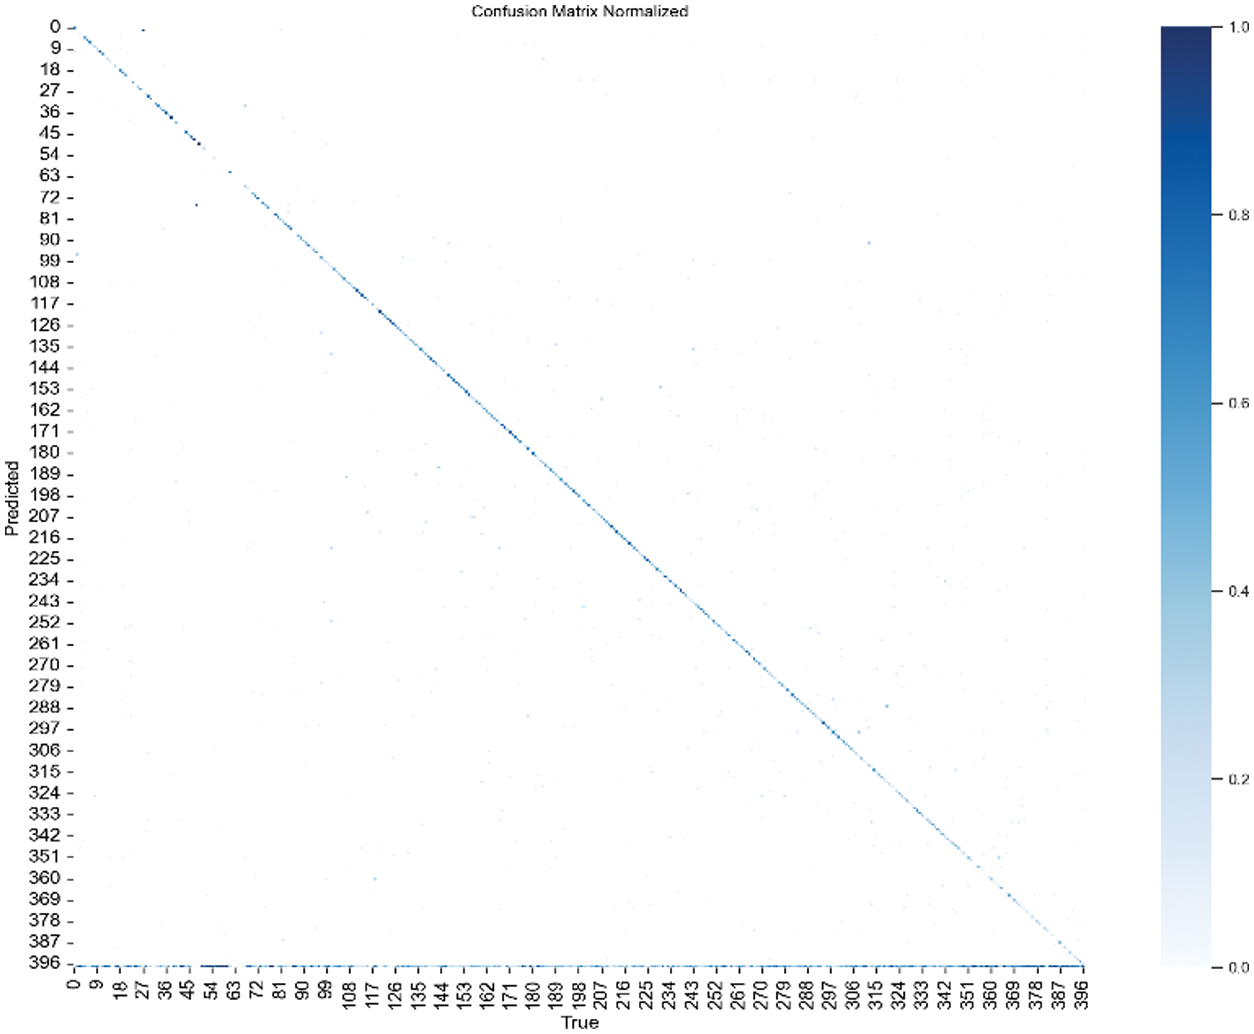 Fig. 36. Confusion matrix for YOLOv11-m variant.
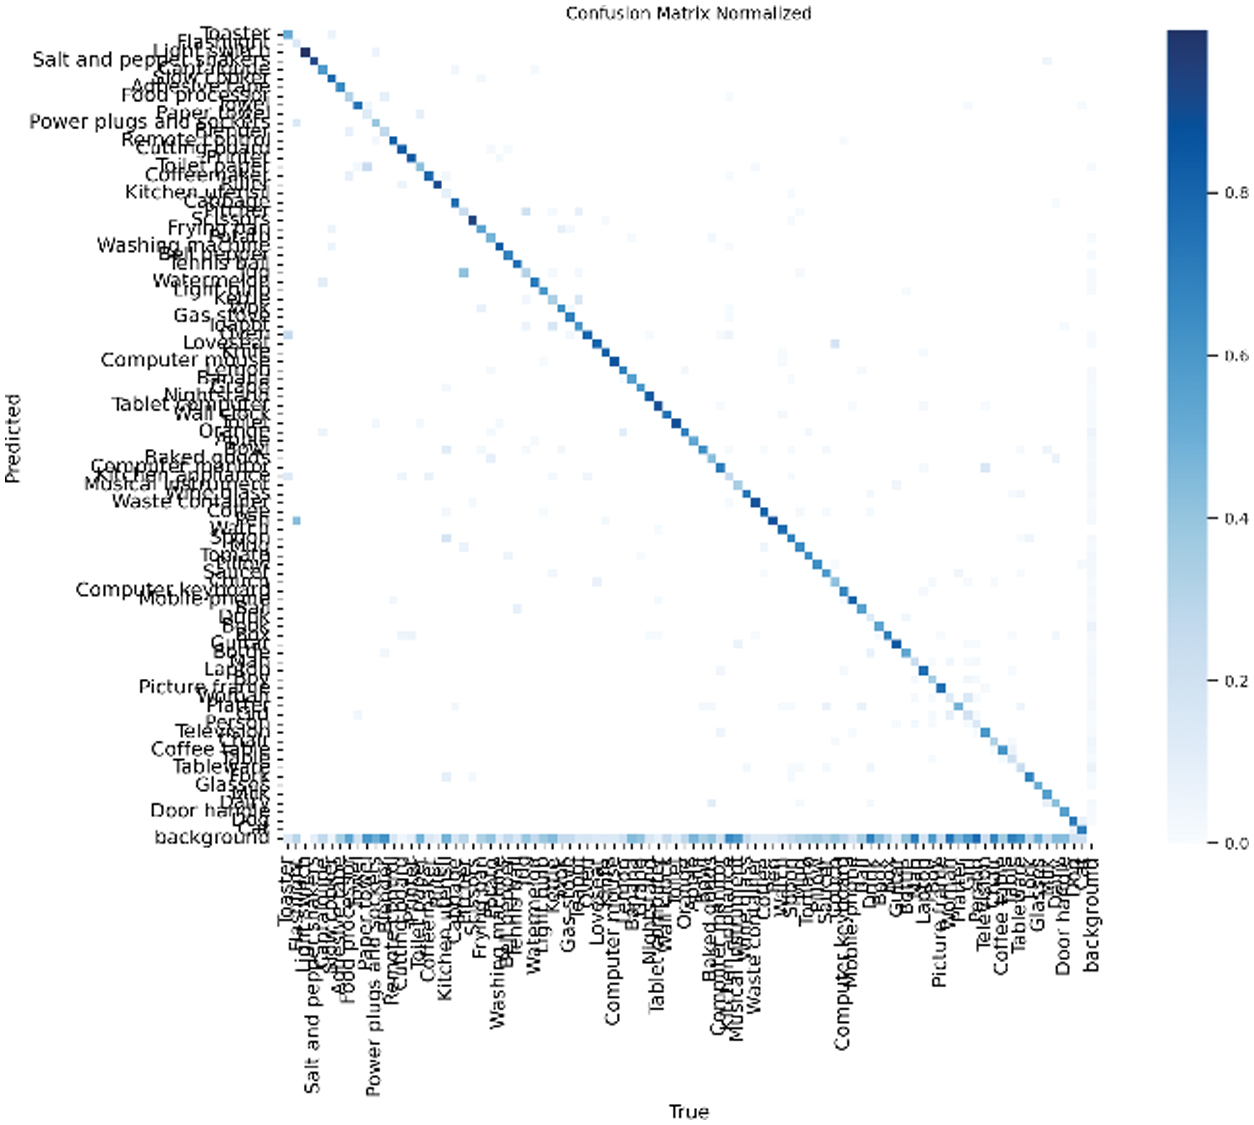 Fig. 37. Confusion matrix for YOLOv11-X-Large variant.
Key Finding: The YOLOv11 X-Large model achieved a 14.6% reduction in false negatives compared to the Medium variant. This improvement indicates that the X-Large model was more effective at minimizing missed detections—an essential capability for assistive applications where failure to recognize key objects could compromise user safety or utility.
D.LATENCY ANALYSIS (ESTIMATED PERFORMANCE)
To provide a preliminary quantitative comparison of inference efficiency across the My Eye AI components, representative latency values were compiled from publicly available benchmarks of models with comparable architectures (YOLOv8/YOLOv10 for YOLOv11 estimates, ViT-B/16 for OWL-ViT, and BLIP-base for captioning).
All values correspond to single-image inference (batch = 1) on a T4 GPU backend at standard input resolutions. These data serve as indicative reference points until full end-to-end measurements are completed (Table IV). Estimated latency and throughput values derived from comparable public benchmarks of YOLOv8/YOLOv10, ViT-B/16, and BLIP-base architectures. All values correspond to single-image inference (batch = 1) on T4 GPU).
Table IV. Estimated latency and throughput values derived from comparable public benchmarks of YOLOv8/YOLOv10, ViT-B/16, and BLIP-base architectures. All values correspond to single-image inference (batch = 1) on T4 GPU
| Model | Backend | Resolution | Query type | Mean (ms) | p50 (ms) | p95 (ms) | p99 (ms) | Throughput (req/s) |
|---|---|---|---|---|---|---|---|---|
| T4 GPU | 640 × 640 | Known | ≈ 420 | ≈ 410 | ≈ 470 | ≈ 510 | ≈ 2.3 | |
| T4 GPU | 768 × 768 | Known | ≈ 690 | ≈ 660 | ≈ 740 | ≈ 790 | ≈ 1.5 | |
| T4 GPU | 768 × 768 | Open-vocab | ≈ 1520 | ≈ 1470 | ≈ 1620 | ≈ 1680 | ≈ 0.65 | |
| T4 GPU | 768 × 768 | Scene caption | ≈ 880 | ≈ 860 | ≈ 930 | ≈ 980 | ≈ 1.1 |
1).INTERPRETATION
These indicative results suggest that OWL-ViT introduces roughly 2–3× greater latency than the YOLOv11 X-Large detector, reflecting the additional transformer computations required for open-vocabulary matching.
Despite this overhead, the hybrid pipeline (YOLO → OWL-ViT → BLIP → TTS) is projected to maintain end-to-end latency below ≈ 1.3 s (p95) under cloud inference—within the real-time threshold typically acceptable for assistive applications.
Subsequent work will report comprehensive empirical benchmarks, including variance across hardware types and mobile edge tests.
V.DISCUSSION AND INNOVATION
This section highlights My Eye AI’s unique innovations compared to existing assistive technologies and discusses technical challenges.
The experiments demonstrated measurable advances: mAP@0.5 improved by 13.5 %, recall by 14.6 %, and F1 from 0.43 to 0.56. False negatives decreased by 14.6 %, and OWL-ViT achieved 71.4 % accuracy on unseen objects. Remaining issues include dataset imbalance and transformer-based latency, both discussed with proposed mitigation strategies.
A.KEY INNOVATIONS
My Eye AI introduces several technological innovations that distinguish it from existing assistive applications. Through a hybrid cloud-mobile architecture, a sequential object detection framework, refined dataset design, and multimodal scene understanding, the system offers enhanced adaptability, performance, and user accessibility for the visually impaired.
1).HYBRID CLOUD-MOBILE ARCHITECTURE
Unlike fully on-device AI systems, My Eye AI employs a cloud-hosted inference API to handle computationally intensive tasks. This design enables real-time processing on mobile devices without requiring high-end hardware. Offloading inference to the cloud ensures seamless scalability, frequent model updates, and low latency across a wide range of smartphones, thereby improving accessibility and reducing device constraints.
2).SEQUENTIAL DETECTION WITH YOLOv11 AND OWL-ViT
To address the limitations of fixed-class object detection, My Eye AI combines YOLOv11 for fast known-object detection with OWL-ViT for open-vocabulary inference. If YOLO fails to recognize an object, the system dynamically engages OWL-ViT, which processes user-defined natural language queries and generates semantic embeddings to locate unfamiliar objects [9]. This dual-model pipeline significantly improves flexibility and usability in open-world settings.
3).OPTIMIZED DATASET AND TRAINING STRATEGY
My Eye AI’s training pipeline leverages a custom-curated dataset focused on common indoor objects. The dataset was reannotated, redundant categories were removed, and class balancing was enforced to ensure equitable model performance across frequent and underrepresented items. The use of the YOLOv11 X-Large variant further improves feature extraction and detection accuracy without requiring specialized hardware, making the system cost-effective and scalable.
4).BLIP FOR MULTIMODAL SCENE UNDERSTANDING
In addition to object-level detection, My Eye AI integrates BLIP to generate rich scene descriptions. BLIP produces contextual, natural language captions based on visual input, offering users a holistic understanding of their environment [6]. This enhances situational awareness and supports navigation, surpassing basic object detection by providing meaningful narrative context.
The addition of BLIP enhanced multimodal understanding, demonstrating the benefit of unifying computer vision and language models for assistive AI.
Practical Impact. The four core innovations—(1) cloud-based inference offload, (2) sequential YOLO → OWL-ViT routing, (3) curated balanced dataset, and (4) BLIP scene captions—translate directly into tangible benefits for end-users:
- •Broader device support without costly wearables,
- •Coverage of unseen objects through natural-language queries,
- •14.6 % fewer missed detections with the YOLOv11-X-Large model, and
- •Richer situational awareness via contextual scene descriptions.
- •These elements collectively improve independence and confidence for visually impaired individuals in daily navigation.
5).TOWARD EDGE-BASED DEPLOYMENT
Although the current version relies on cloud infrastructure, My Eye AI is designed for future deployment on edge devices. Ongoing development focuses on shifting inference to mobile hardware, enabling fully offline functionality. This evolution enhances user privacy, reduces reliance on internet connectivity and ensures continuous accessibility in low-bandwidth environments.
Key Takeaway: My Eye AI’s layered innovation—cloud-based inference, open-vocabulary detection, dataset optimization, and integration of scene understanding—positions it as a next-generation assistive system. It bridges the gap between high-performance object recognition and practical, real-world deployment for visually impaired users.
B.CHALLENGES AND SOLUTIONS
Despite the notable advancements introduced by My Eye AI, several technical challenges remain. This section outlines key limitations encountered during system development and proposed strategies for addressing them in future work.
1).CLASS IMBALANCE
The training dataset exhibited significant class imbalance, with some object categories containing over 1,600 samples while others had fewer than 50. This disparity adversely affected generalization, particularly for underrepresented objects.
Proposed Solution: Future training cycles will implement strategies such as oversampling underrepresented classes and undersampling overrepresented ones and applying class-weighted loss functions. These techniques aim to enhance balanced learning and improve detection performance across all object categories.
2).OVERFITTING
Even with the improved YOLOv11 X-Large configuration, overfitting remained a challenge, becoming evident beyond epoch 132 as validation performance began to degrade.
Proposed Solution: To address overfitting, regularization techniques such as dropout, L2 weight penalties, and early stopping will be explored. Additionally, increasing training data diversity through data augmentation or targeted collection of underrepresented object views may further improve generalization.
3).REAL-TIME PERFORMANCE CONSTRAINTS
While OWL-ViT offers powerful open-vocabulary detection, its transformer-based architecture introduces additional inference time, which can hinder real-time responsiveness on mobile devices.
Proposed Solution: Performance optimization strategies such as model quantization, parameter pruning, and transitioning toward edge-based inference will be adopted. These methods aim to reduce model size and computational demand, enabling low-latency operation suitable for assistive real-time use cases.
VI.CONCLUSION AND FUTURE WORK
This project presented the design, implementation, and evaluation of My Eye AI, a mobile-based assistive system aimed at enhancing the independence and situational awareness of visually impaired individuals. Built using conventional smartphone resources and powered by a hybrid cloud-mobile architecture, the system delivered real-time object detection, contextual scene understanding, and open-vocabulary recognition.
My Eye AI integrated a dual-stage detection pipeline consisting of YOLOv11 for fast, known-object recognition and OWL-ViT for zero-shot detection of novel objects using natural language queries. The retrained YOLOv11 X-Large model achieved substantial performance gains: mAP@0.5 increased from 0.443 to 0.578, recall improved from 0.457 to 0.603, and F1 score rose from 0.43 to 0.56. Furthermore, OWL-ViT successfully detected 71.4% of unseen objects, significantly expanding the system’s flexibility and real-world applicability.
Despite these advancements, several challenges remain. Overfitting was observed beyond epoch 132, and class imbalance continued to affect detection performance across rare object categories. Additionally, the transformer-based OWL-ViT architecture introduced latency that may hinder responsiveness on lower-end devices.
To address these limitations, future development will focus on:
- •Using higher input resolutions (e.g., 1024) to enhance fine-grained localization
- •Employing advanced training strategies, such as multi-scale training, AdamW optimization, and targeted data augmentation
- •Deploying lightweight models through quantization and pruning for mobile optimization
- •Migrating inference to edge devices to ensure offline, low-latency accessibility
- •Improving dataset balancing and incorporating user-driven feedback mechanisms to refine detection relevance
- •Maintain p95 latency < 1.2 s on mid-range smartphones via cloud inference,
- •Reduce OWL-ViT latency by ≥ 30 % using quantization and pruning, and
- •Achieve SUS ≥ 80 in a controlled user study of 8–12 visually impaired participants.
Planned tasks include T1—object query, T2—obstacle/way-finding, and T3—scene summary. Metrics will include success rate, response time, perceived helpfulness, and qualitative feedback. Ethics approval and accessibility accommodations will be ensured.
Together, these enhancements will advance My Eye AI toward becoming a robust, scalable, and context-aware assistive solution—bridging the gap between cutting-edge computer vision and practical deployment for the visually impaired. The system’s modular design, open-vocabulary capability, and adaptability position it as a next-generation tool for real-world assistive technology.