I.INTRODUCTION
Like other organs, bones are critical to structure and function. Excessive force causes bones to change size, become stronger, weaker, or even break. Unlike most other organs, bones can grow back and heal without disfiguring. Human babies have about 270 bones, according to the National Library of Medicine. Many are fused together during development to become the 206 to 213 bones in an adult skeleton.
One of the most common musculoskeletal ailments distressing millions of people worldwide, knee osteoarthritis (KOA) affects daily mobility and quality of life. KOA is the fourth utmost common reason of disability worldwide and is characterized by joint space narrowing, subchondral osteosclerosis (hardening beneath cartilage), osteophyte formation (bone spurs), and cartilage breakdown. KOA is most common in adulthood and causes chronic pain and functional disability. Initial and precise diagnosis is important for operative intervention, discomfort management, and slowing the disease process. [1–4].
Clinicians primarily diagnose KOA through X-ray imaging via the KL grading system that classifies severity into 5 grades – from Grade Ranking 0 (normal) to 4 (severe KOA). Early detection of KOA, especially Grades 0, 1, and 2, is critical for timely treatment to prevent irreversible joint damage. However, early discovery of KOA is challenging due to understated radiographic deviations that may be problematic to detect. Manual diagnosis by experienced radiologists is standard but prone to variability and error. Automated Deep Learning (DL) models have been proposed to improve KOA diagnosis accuracy and standardization. [5–8].
Several DL algorithms such as XGBoost, CNN, VGG, ResNet, RNN, and MobileNet have been explored for KOA classification and have demonstrated high precision in feature mining and anomaly detection from medical images. However, integrating clinical biomarkers such as inflammatory markers, metabolic indices, and biomechanical factors along with imaging modalities such as X-rays, MRI, and CT scans provides an additional holistic approach to disease characterization and prognosis. [9].
Most existing studies focus on unimodal approaches [10]. In this paper, we propose an innovative cross-modal learning framework that fuses heterogeneous medical data (KOMMCF: Knee Osteoarthritis Multi-Modal Classification Framework). The model is trained using X-ray images and 14 clinical biomarkers (Table I) to predict Kellgren–Lawrence (KL) grades, which provide a standardized way to quantify KOA severity. These biomarkers are derived from the osteoarthritis initiative (OAI) clinical assessment protocol and represent semi-quantitative measures of cartilage degeneration, osteophyte formation, and subchondral bone changes. After pre-processing the clinical data, we had total 32 biomarker features because the model used 14 bilateral differences + 14 patient-normalized biomarkers + 4 clinical/structural features, not just the 14 raw biomarkers because these raw measurements alone were insufficient to capture the complex and heterogeneous progression patterns of KOA. Rather than introducing redundant information, the expanded representation explicitly encodes inter-patient normalization, intra-patient asymmetry, and clinically meaningful interactions, which are critical for robust ordinal learning. This helped the proposed model capture the transitions between severity levels, especially between consecutive KL grades, which aided improve ordinal agreement and severity deviation error rates.
Table I. Biomarker definitions (OAI-derived)
| Abbrev | Full name | Description |
|---|---|---|
| Osfl | Osteophytes (femoral, lateral) | Bone spurs on lateral femur (0-3 scale) |
| Scfl | Sclerosis (femoral, lateral) | Bone hardening lateral femur (0-3) |
| Cyfl | Cyst (femoral, lateral) | Cysts lateral femur (0-3) |
| Ostm | Osteophytes (tibial, medial) | Bone spurs medial tibia |
| Sctm | Sclerosis (tibial, medial) | Hardening medial tibia |
| Cytm | Cyst (tibial, medial) | Cysts medial tibia |
| Attm | Attrition (medial) | Bone erosion medial compartment |
| Osfm | Osteophytes (femoral, medial) | Bone spurs medial femur |
| Scfm | Sclerosis (femoral, medial) | Hardening medial femur |
| Cyfm | Cyst (femoral, medial) | Cysts medial femur |
| Ostl | Osteophytes (tibial, lateral) | Bone spurs lateral tibia |
| Sctl | Sclerosis (tibial, lateral) | Hardening lateral tibia |
| Cytl | Cyst (tibial, lateral) | Cysts lateral tibia |
| Attl | Attrition (lateral) | Bone erosion lateral |
By making the most of the complementarities in multi-modal data, the projected system expects to expand the reliability of diagnoses, enhance the identification of the ailment in the early phases, and support doctors to better manage patients with osteoarthritis of the knee.
The rest of the paper is systematized as follows. Section II comprehends the review of the pertinent literature. Section III discusses the methodology, which includes the dataset, proposed framework, algorithm, and results. Section IV concludes the paper by deliberating the limitations and possible guidelines for impending research.
II.Literature Review
In the research of Kohn et al. [11], deep learning methods such as CNNs and RNNs prove extremely adept at interpreting medical images and identifying abnormalities. Recent studies have explored the use of DL techniques for predicting abnormalities within the knee using different imaging modalities. The KL technique remains widely used despite its limitations. The grading technique by KL has been useful but only as an adjunct when combined with a comprehensive clinical examination.
The work of Kokkotis et al. [12] have investigated machine learning algorithms including Bayesian methods, Decision Trees, SVM, and ANN to diagnose and forecast KOA. They highlighted that incorporating image, genomic, and clinical information could improve diagnostic accuracy.
A fusion tactic was also proposed by Mahum et al. in [13], which combined handcrafted features and CNNs for the diagnosis of KOA from X-ray images. This approach improved the accuracy of the diagnosis compared to the use of a CNN alone. However, the approach was unimodal and did not use any clinical biomarkers.
Researchers Kim et al. [14] studied the effect of combining patient information with imaging facts on the prediction of KOA severity using DL. The study carried out two experiments: one using simply imaging data and the other combining imaging and clinical data. A CNN model with six SE-ResNet was utilized to build the modules. The findings revealed that integrating patient info improved the AUC scores for each KL grade, with AUCs of 0.91, 0.80, 0.69, 0.86, and 0.96 for the imaging-only model and 0.97, 0.85, 0.75, 0.86, and 0.95 for the model that included both imaging and clinical data. KL grade 2 has been regarded as the most difficult to anticipate, but overall performance was improved.
The authors of this paper, Liu et al. [15], introduced a novel approach that was an integrated multi-modal learning method (MMLM) for detecting early-stage knee OA. In that they combined clinical, imaging, and demographic data to enhance categorization. To integrate clinical and imaging data, the approach utilized ResNet50 and XGBoost for feature extraction and optimized the fusion through L1-norm regularization. When tested on the OAI dataset, MMLM outperformed models that use only imaging or mixed data, with 83.45% accuracy, 79.27% precision, and 84.83% F1-score. The findings showed that MMLM considerably improves OA classification accuracy and interpretability.
Norman et al. [16] proposed an automated Deep Learning (DL) framework to classify the severity of knee osteoarthritis using the Kellgren–Lawrence (KL) grading system. First, A U-Net architecture was first used to precisely localize the left and right knee joints, enabling automated and consistent extraction of regions of interest. The localized knee images from multiple models were then used to train an ensemble model to predict osteoarthritis severity across the KL grades. Sensitivities of the ensemble were 83.7% for no OA, 70.2% for mild, 68.9% for moderate, and 86.0% for severe OA. The specificities were 86.1% for no OA, 83.8% for mild, 97.1% for moderate, and 99.1% for severe OA. The method was believed to be high performance for moderate and severe OA. However, the sensitivity was poor for mild and early-stage OA which presents the challenge of relying on radiography alone to determine the initial stages of the disease.
The study by Teh et al. [17] focused on the usage of multi-modal neural networks to diagnose KOA by mixing organized demographic data with unstructured imaging data. Three deep learning unimodal models – DIKO, InceptionV3, and EfficientNetv2 – were converted into multi-modal models by combining picture features with demographic information. Contrary to predictions, the results demonstrate that unimodal models (InceptionV3 and DIKO) outperform multi-modal models, with accuracies of 0.75 and 0.67 for 3-class severity classification. According to the findings, unimodal models may be sufficient for diagnosing knee OA, contradicting the idea that multi-modal models usually perform better.
In the study, author Slimane [18] projected an innovative multi-modal tactic for predicting KOA development by integrating biomarkers, clinical, and imaging data. He demonstrated accurate knee abnormality progression using deep learning and ensemble models and suggested using multi-modal data fusion to improve prediction of knee OA progression, providing cutting-edge information to drive personalized care and optimize clinical outcomes, which leveraged combined data modalities and outperformed single-source approaches by achieving an AUC improvement from 79% to 82% and AP from 68% to 72%.
The researchers Castagno et al. [19] built an autoML tool to predict the swift accelerations of knee OA. The autoML representations include medical, biological, and MRI and X-ray cross-sectional data. The OAI provided the datasets for training, validation, and external validation. The models predict OA progression for multi-class (pain/radiographic) and binary outcomes. The results show that simplified models that utilized only clinical factors performed adequately, achieving an AUC-PRC of 0.727 for the multi-class and 0.764 for the binary predictions. Multi-class models worked best for early-stage OA, whereas binary models were more steadfast for those 60 and younger.
Wang et al. [20] examined how complicated it is to train multi-modal classification networks. They discussed issues regarding imbalance of modalities, optimization, and cross-modal feature misalignment. In their findings, they discussed balanced sampling and improved fusion as useful and suggested that design is an important factor to consider for effective and stable multi-modal training.
Althnian et al. [21] demonstrated that smaller datasets resulted in a model that over-fitted and lacked generalization. Conversely, larger datasets improved model robustness and accuracy. This indicates the importance of having large volume, quality datasets that pertain to the medical field in order to derive dependable AI models for use in healthcare.
Using radiographic images from the OAI dataset, Mohammed et al. [22] assessed the automated classification of KOA smearing various pretrained deep neural network architectures. They assessed six different models (VGG16, VGG19, ResNet101, MobileNetV2, InceptionResNetV2, and DenseNet121) in a binary, three-class, and five-class cataloguing for the KL grading system. They acknowledged ResNet101 as best model with classification accurateness of 83%.
Lee et al. [23] developed a model based on a no-code AI platform (DEEP:PHI) with a ResNet101 model. The model was applied to a dataset from OAI to evaluate the knee radiographs and estimate the severity of osteoarthritis based on the first five levels of the KL grade. The model corroboration for the KL grade outcome reported that the model attained an average accurateness of 80.2% in the KL grade. The model was able to accurately grade moderate to severe osteoarthritis, but the accuracy was poor in early KL grades.
The work of distinguishing the initial stage of KL osteoarthritis from moderate and severe stages of osteoarthritis was the aim of the research work by Choi et al. (2025) [24]. A new AI approach to the KL grade system of KOA severity classification was the basis of the research work. This work compared the efficiency of various models. A total of 15,000 images of the knee X-rays were segmented based on 0, 1, 2, 3, and 4 grades of KL. Each of the models of DL algorithms (DenseNet201, ResNet101, and EfficientNetV2) was trained using the 15,000 images, and the efficiency of the DenseNet201 model reached 73% accuracy.
Architectural advancements such as EfficientNetV2, developed by Tan and Le [25], enhance computational efficiency by providing more compact models that enable faster training while maintaining high accuracy.
Summary of literature review is highlighted in Table II.
Table II. Literature review summary for year 2020 to 2025
| Ref | Author (Year) | Data Modality | Model/method | Classification setting | Key performance | Key limitation |
|---|---|---|---|---|---|---|
| [ | Kokkotis et al. (2020) | Imaging + clinical + genomic | ML survey (SVM, ANN, Bayesian, DT) | Various | — | No unified multi-modal framework |
| [ | Mahum et al. (2021) | X-ray | Hybrid handcrafted + CNN | Binary/Multi-class | Improved vs CNN-only | Unimodal; no biomarkers |
| [ | Kim et al. (2020) | X-ray + clinical | SE-ResNet | 5-class KL | AUC up to 0.97 (multi-modal) | KL-2 hardest to classify |
| [ | Liu et al. (2023) | Imaging + clinical + demographic | ResNet50 + XGBoost (MMLM) | 3-class | 83.45% accuracy | No ordinal loss modeling |
| [ | Teh et al. (2024) | Imaging + demographic | InceptionV3, DIKO, EfficientNetV2 | 3-class | Accuracy 0.75 (unimodal best) | Multi-modal fusion instability |
| [ | Slimane (2024) | Imaging + biomarkers + clinical | Multi-modal DL + ensemble | Progression prediction | AUC 79% → 82% | Focus on progression |
| [ | Castagno et al. (2024) | Clinical + MRI + X-ray | AutoML | Binary/Multi-class | AUC-PRC 0.727/0.764 | Imaging less influential |
| [ | Althnian et al. (2021) | Medical datasets | Dataset size analysis | — | Larger datasets → higher accuracy | Not OA-specific |
| [ | Mohammed et al. (2023) | X-ray | ResNet101, VGG, DenseNet | Binary/3/5-class | 83% accuracy (binary) | Imaging-only |
| [ | Lee et al. (2024) | X-ray | ResNet101 (No-code AI) | 5-class KL | Avg. accuracy 80.2% | Low early OA accuracy |
| [ | Choi et al. (2025) | X-ray | DenseNet201 | 5-class KL | 73% accuracy | Weak KL-1 performance |
| [ | Tan and Le (2021) | Image (generic) | EfficientNetV2 | — | High efficiency | Not OA-specific |
III.METHODOLOGY
Convolutional and recurrent neural networks have also gained popularity in the analysis of KOA. The recent standard in the assessment of KOA is the KL grade, despite its limitations. For the purpose of improving the accuracy of diagnosis, previous researchers have also considered the use of a combination of radiographic images and clinical parameters. They have demonstrated that the use of patient-specific parameters, such as age, gender, BMI, and biochemical parameters, improves the accuracy of classification, especially in the early stage.
The proposed KOMMCF has been designed to overcome the foremost challenges in the traditional diagnosis of KOA. The existing diagnosis technique is mainly based on X-ray images, which have less sensitivity towards the minute changes that occur in the early stage of KOA and lead to delayed diagnosis. In addition, the KL grading discrepancies and imbalance in the severity levels can negatively impact the diagnosis. Finally, the vagueness in the KL grading system, especially in the neighboring grades, can negatively impact the system’s effectiveness in the decision-making process for the treatment of KOA. KOMMCF overcame these challenges through the inclusion of multi-modal data and readjusting the KL grading system to accurately capture the clinically important differences in severity.
A.DATASET
The KL grading system is employed to assess the severity of knee OA:
- 1.X-Ray images: The data are separated into train, test, and validation sets and then into 5 subfolders based on the KL grade, ranging from 0 to 4, indicating the progression from healthy knees to severely arthritic knees.
- 2.Clinical_info.csv: Contains information about each patient, including patient demographics (ID, side, age, height, weight, BMI), clinical symptoms (frequent pain, surgery history, knee joint symptoms), knee injury and osteoarthritis outcome score, and other health indicators.
- 3.Multilabel_missing-filled1.csv: Contains the following columns: ID, Side: Identifiers for the knee image, KL Grade: The KL grading of the knee (ranging from 0 to 4), osteophytes, joint space narrowing, and other clinical features: These columns describe the severity of different knee OA features such as osteophytes, joint space narrowing, and subchondral sclerosis (bone changes under the cartilage), File Path: The actual path to the image file in the dataset.
Source: https://www.kaggle.com/code/hungpham103/xdesco-mapr-convnext-5kl/input
Acknowledgements: Chen, Pingjun (2018), “Knee Osteoarthritis Severity Grading Dataset,” Mendeley Data, V1, doi: 10.17632/56rmx5bjcr.1 The dataset is organized from OAI. Source of Database is available here: https://data.mendeley.com/datasets/56rmx5bjcr/1.
Library: TensorFlow/Keras, NumPy & Pandas, OpenCV (cv2): Used for image processing (e.g., grayscale conversion, histogram equalization, edge detection), Scikit-learn: Provides utilities for label encoding, scaling, and computing class weights, Matplotlib: Used for visualization.
B.PROPOSED FRAMEWORK
We proposed a KOMMCF: an innovative classification strategy that integrated clinical parameters, biomarker profiles, and X-ray imaging to enhance KOA diagnosis, alongside a modified KL grading scheme that merges grades 1 & 2 and 3 & 4 for streamlined classification. The framework preprocessed X-ray images via grayscale, sharpening, and Contrast Limited Adaptive Histogram Equalization (CLAHE)-based contrast enhancement, histogram equalization, and Canny edge detection to capture the outlines and bone contours that are key indicators of osteoarthritis progression. CNNs extracted features via convolution layers with ReLU activation, feature reduction via global average pooling, and a fully connected dense layer. Multi-layer perceptron (MLPs) extracted clinical data features via transforming input data through dense layers with ReLU activation.
Features extracted from both modalities were fused via a fully connected layer to construct a consolidated feature vector. Final KL grade classification was performed using a softmax layer with distance-aware ordinal loss function which combined regular cross-entropy with an extra penalty as the objective function for optimization via the Adam optimizer. For training, we used patient-wise Group K-Fold cross-validation. This means that data from the same person never appear in both the training and testing sets, which prevents data leakage and makes the evaluation more reliable. Training continued for multiple epochs until convergence, and performance was evaluated via key metrics. The proposed multi-modal approach improved classification accuracy and reliability and made it a promising candidate for automated KOA diagnosis. The overall architecture of the proposed KOMMCF is shown in Fig. 1. It depicts the parallel architecture of CNN and MLP, feature fusion, and ordinal classification.
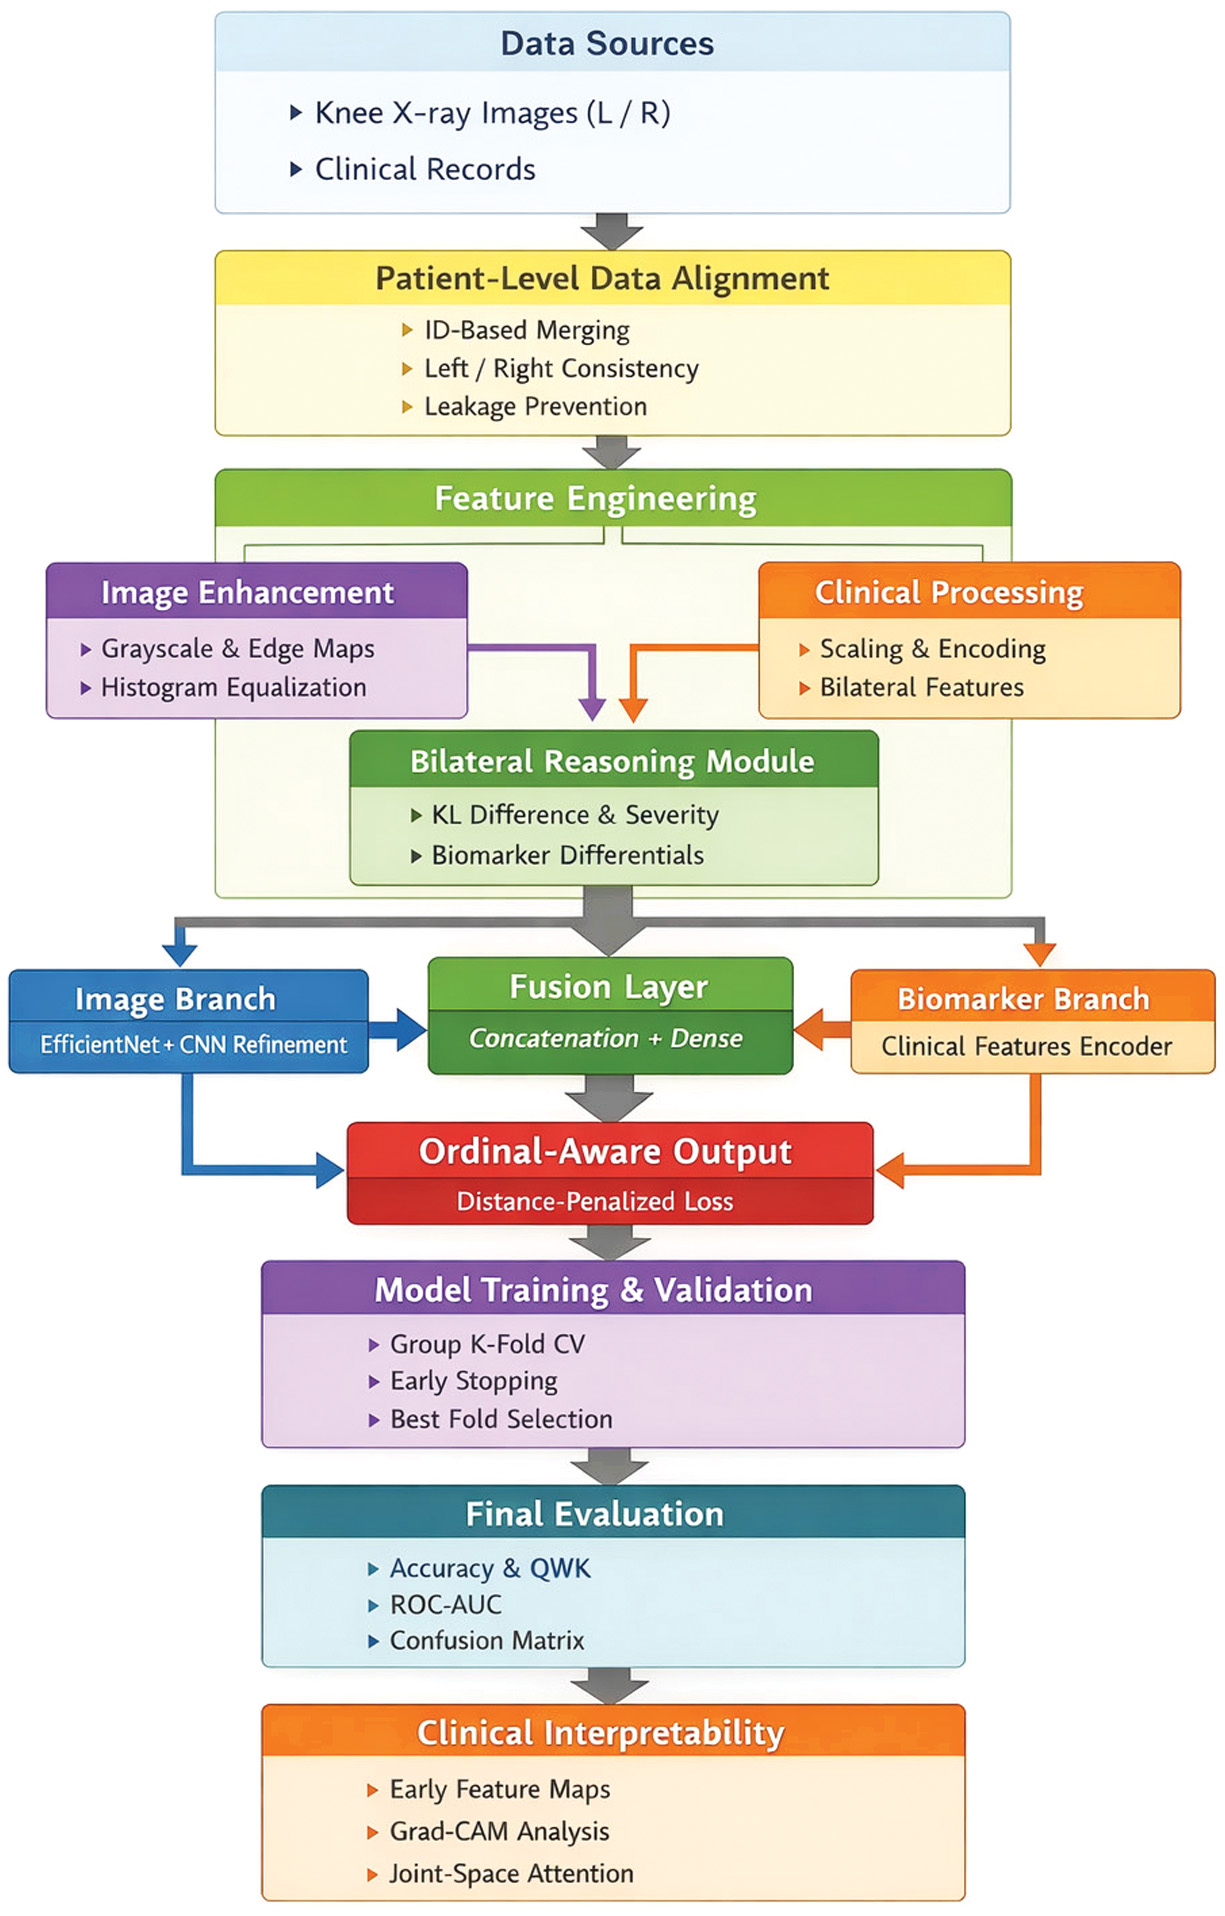 Fig. 1. Model architecture: Knee osteoarthritis multi-modal classification framework (KOMMCF).
Algorithm:
- 1.Input data: X-ray images, Ximg, and clinical data, Xclin. Every sample is related to a knee joint (either left or right) and is grouped at the patient level.
- 2.Pre-process: Each X-ray image undergoes pre-processing to improve the structural information:
- a.Grayscale Conversion to emphasize bone structures
- b.Sharpening Filter to enhance joint boundaries
- c.CLAHE for local contrast enhancement
- d.Gaussian Denoising to reduce noise
- e.Canny Edge Detection for structural edge extraction
- 3.Feature Extraction from Image Data: CNN consists of convolutional layers: where
- •Wconv, bconv are convolution weights and biases
- •∗ represents the convolution operation
- •σ is the ReLU activation function
- •Applied feature reduction via global average pooling and fully connected dense layer.
- 4.Feature refinement steps:
- •Additional convolution + batch normalization layers
- •Global average pooling for spatial feature reduction
- •Fully connected dense layers to obtain the final image embedding
- 5.Feature Extraction from Clinical Data (MLP): Each layer transformation: where
- •fθMLP represents a MLP
- •Fclin is the extracted feature vector from clinical data
- •W(l), b(l) are the weights and biases for layer
- •φ is the ReLU activation
- •This branch encodes:
- ○Symptom severity scores
- ○Age–KL interaction features
- ○Side indicators
- ○Bilateral difference features
- ○Patient-normalized biomarker features
- •Final clinical feature vector:
- 6.Multi-modal Feature Fusion
- •The learned image and clinical representations are concatenated:
- •A dense fusion layer learns cross-modal interactions:
- 7.Prediction: The final fused feature vector is passed through a softmax layer to predict KL severity classes:
- 8.Ordinal Distance-Aware Loss Computation: To respect the ordinal nature of KL grades, a distance-weighted ordinal loss is used: where
- •LCE is categorical cross-entropy
- •Lordinal penalizes predictions proportionally to class distance
- •λ controls ordinal penalty strength
- 9.Optimization: Update the model parameters with Adam optimizer.With:
- ○Learning rate scheduling (ReduceLROnPlateau)
- ○Early stopping to prevent overfitting
- 10.Evaluation Metrics: The model is evaluated using patient-wise Group K-Fold cross-validation to avoid data leakage.Performance metrics include the following:
- ○Accuracy
- ○Quadratic weighted Cohen’s kappa (QWK)
- ○Confusion matrix
- ○Mean absolute error (MAE)
- 11.Repeat: Train the model for multiple epochs until convergence.
- ○Multiple epochs per fold
- ○All folds in Group K-Fold CV
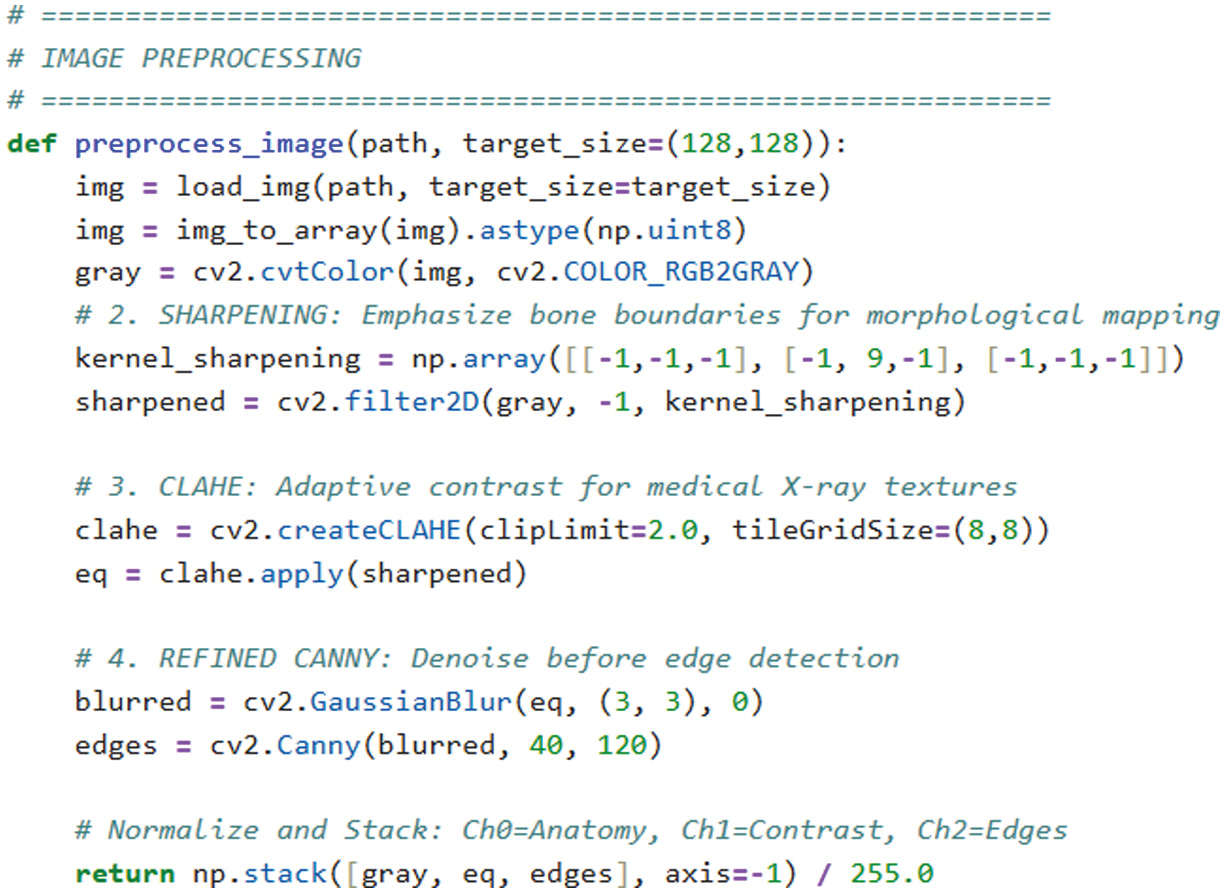 Fig. 2. Image processing code snippet.
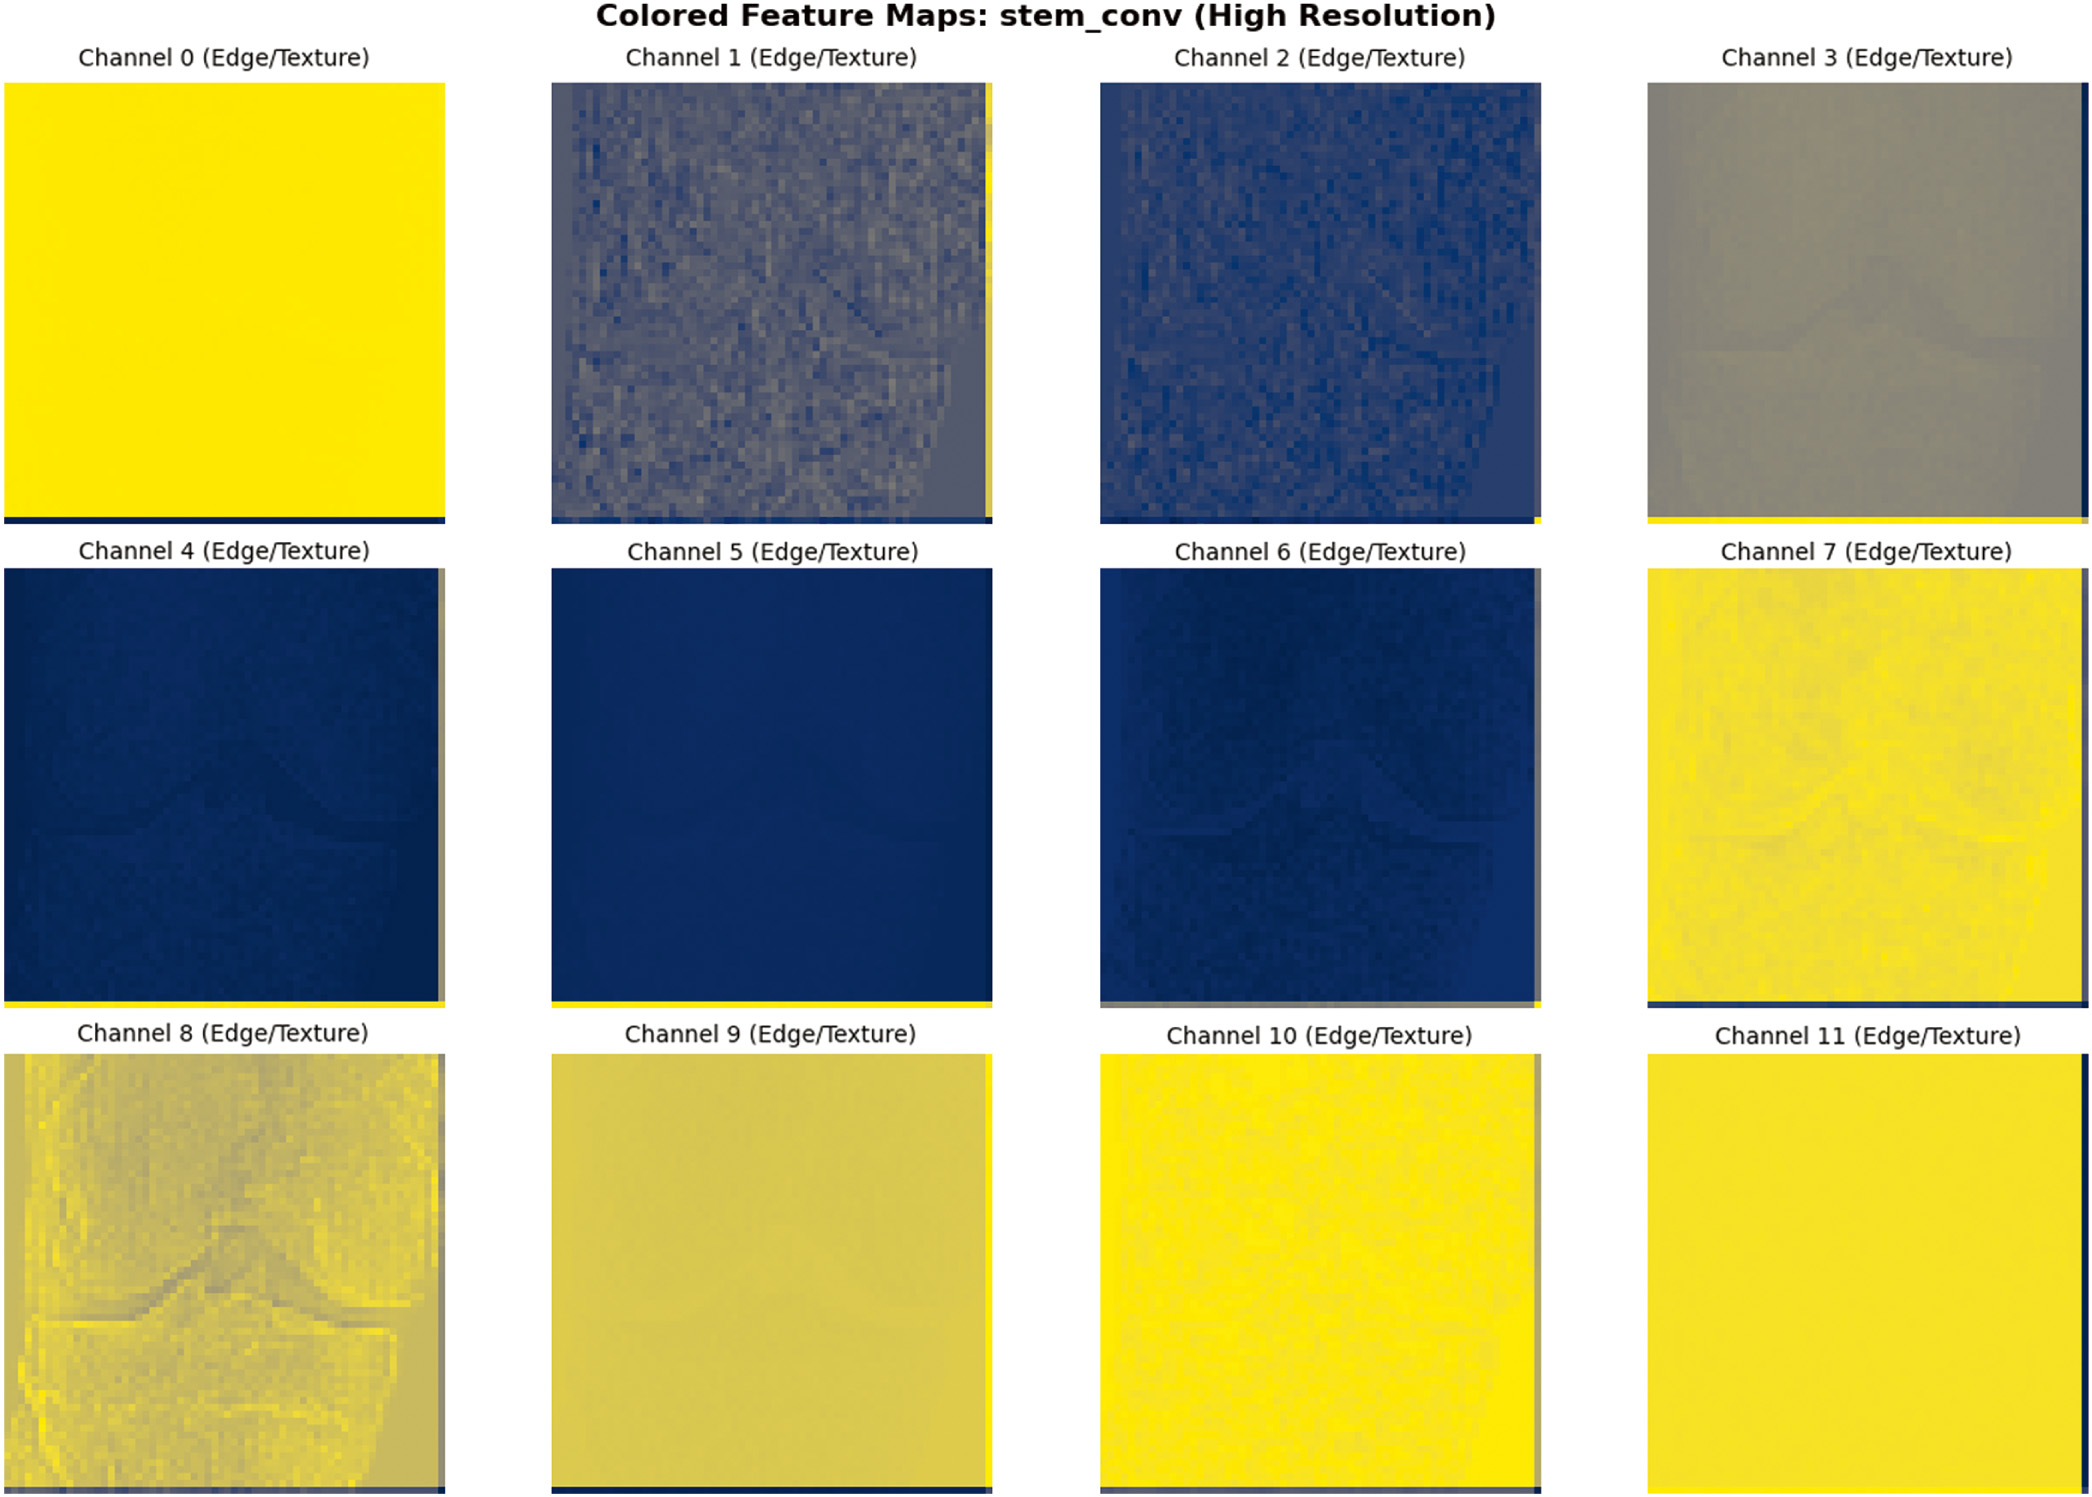 Fig. 3. Sample image feature extraction visualization.
C.EVALUATION
To avoid data leakage between bilateral knee samples, patient-wise Group K-Fold cross-validation was used to test model with validation and test dataset 3-class (Normal, Early OA, Moderate-Severe). Fold-wise accuracy of Group K-Fold for 3-class KOMMCF is shown in Fig. 6.
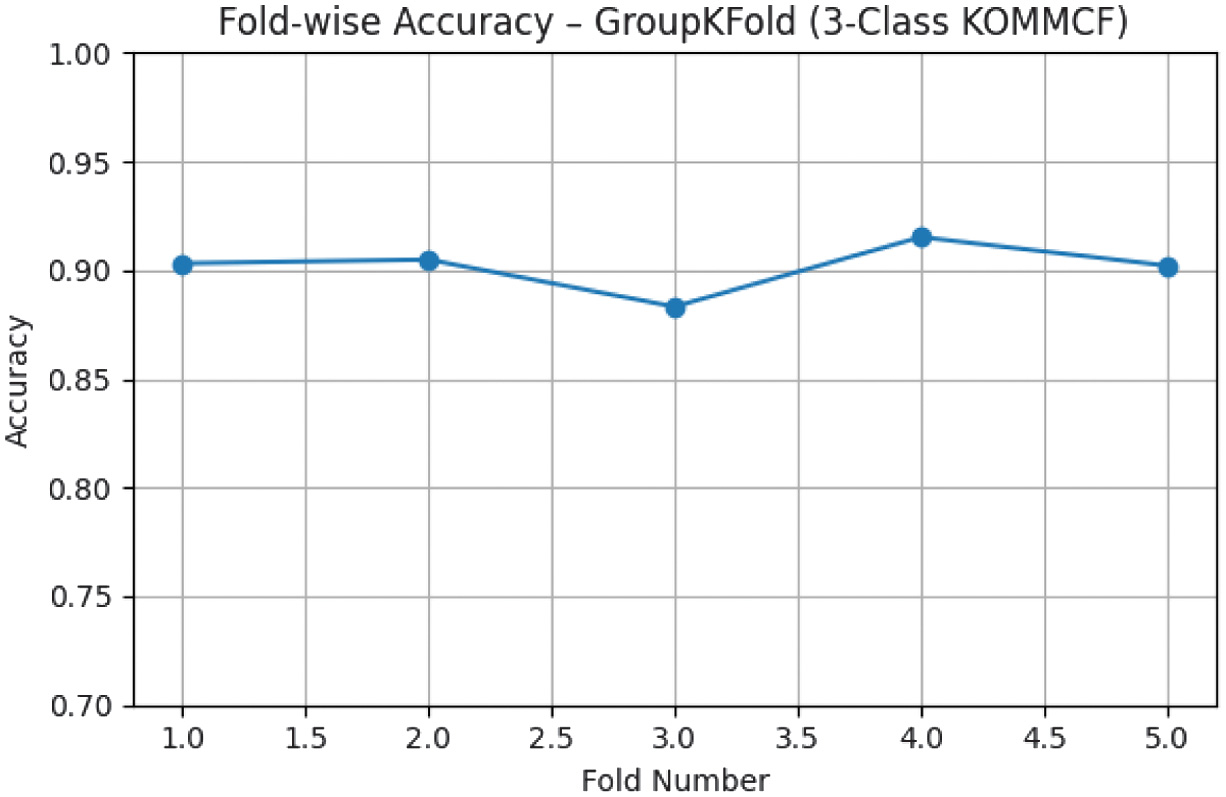 Fig. 6. Fold-wise accuracy – Group K-Fold (3-Class KOMMCF Model).
The model performance was assessed with accuracy, QWK, MAE, precision, recall, and F1-score, and confusion matrix. A detailed confusion matrix analysis for each classification setting is provided, where special focus is placed on analyzing misclassifications between adjacent classes. Confusion matrix of 3-class KOMMCF for validation and test data is shown in Table III, and ROC curves for the same are shown in Table III.
Table III. Confusion matrix and ROC curve of KOMMCF model for 3 – Class validation and test data
| Validation data | Test data |
|---|---|
To enhance transparency and to gain trust in the models, we also applied Grad-CAM to high spot the most relevant regions in X-ray images that led the model to make its prediction, which is crucial to clinical validation as it confirms that the model is relying on anatomical features of importance and not noise or irrelevant artifacts. Grad-CAM visualizations highlighting clinically relevant regions influencing KOMMCF predictions across different OA severity levels are presented in Fig. 7.
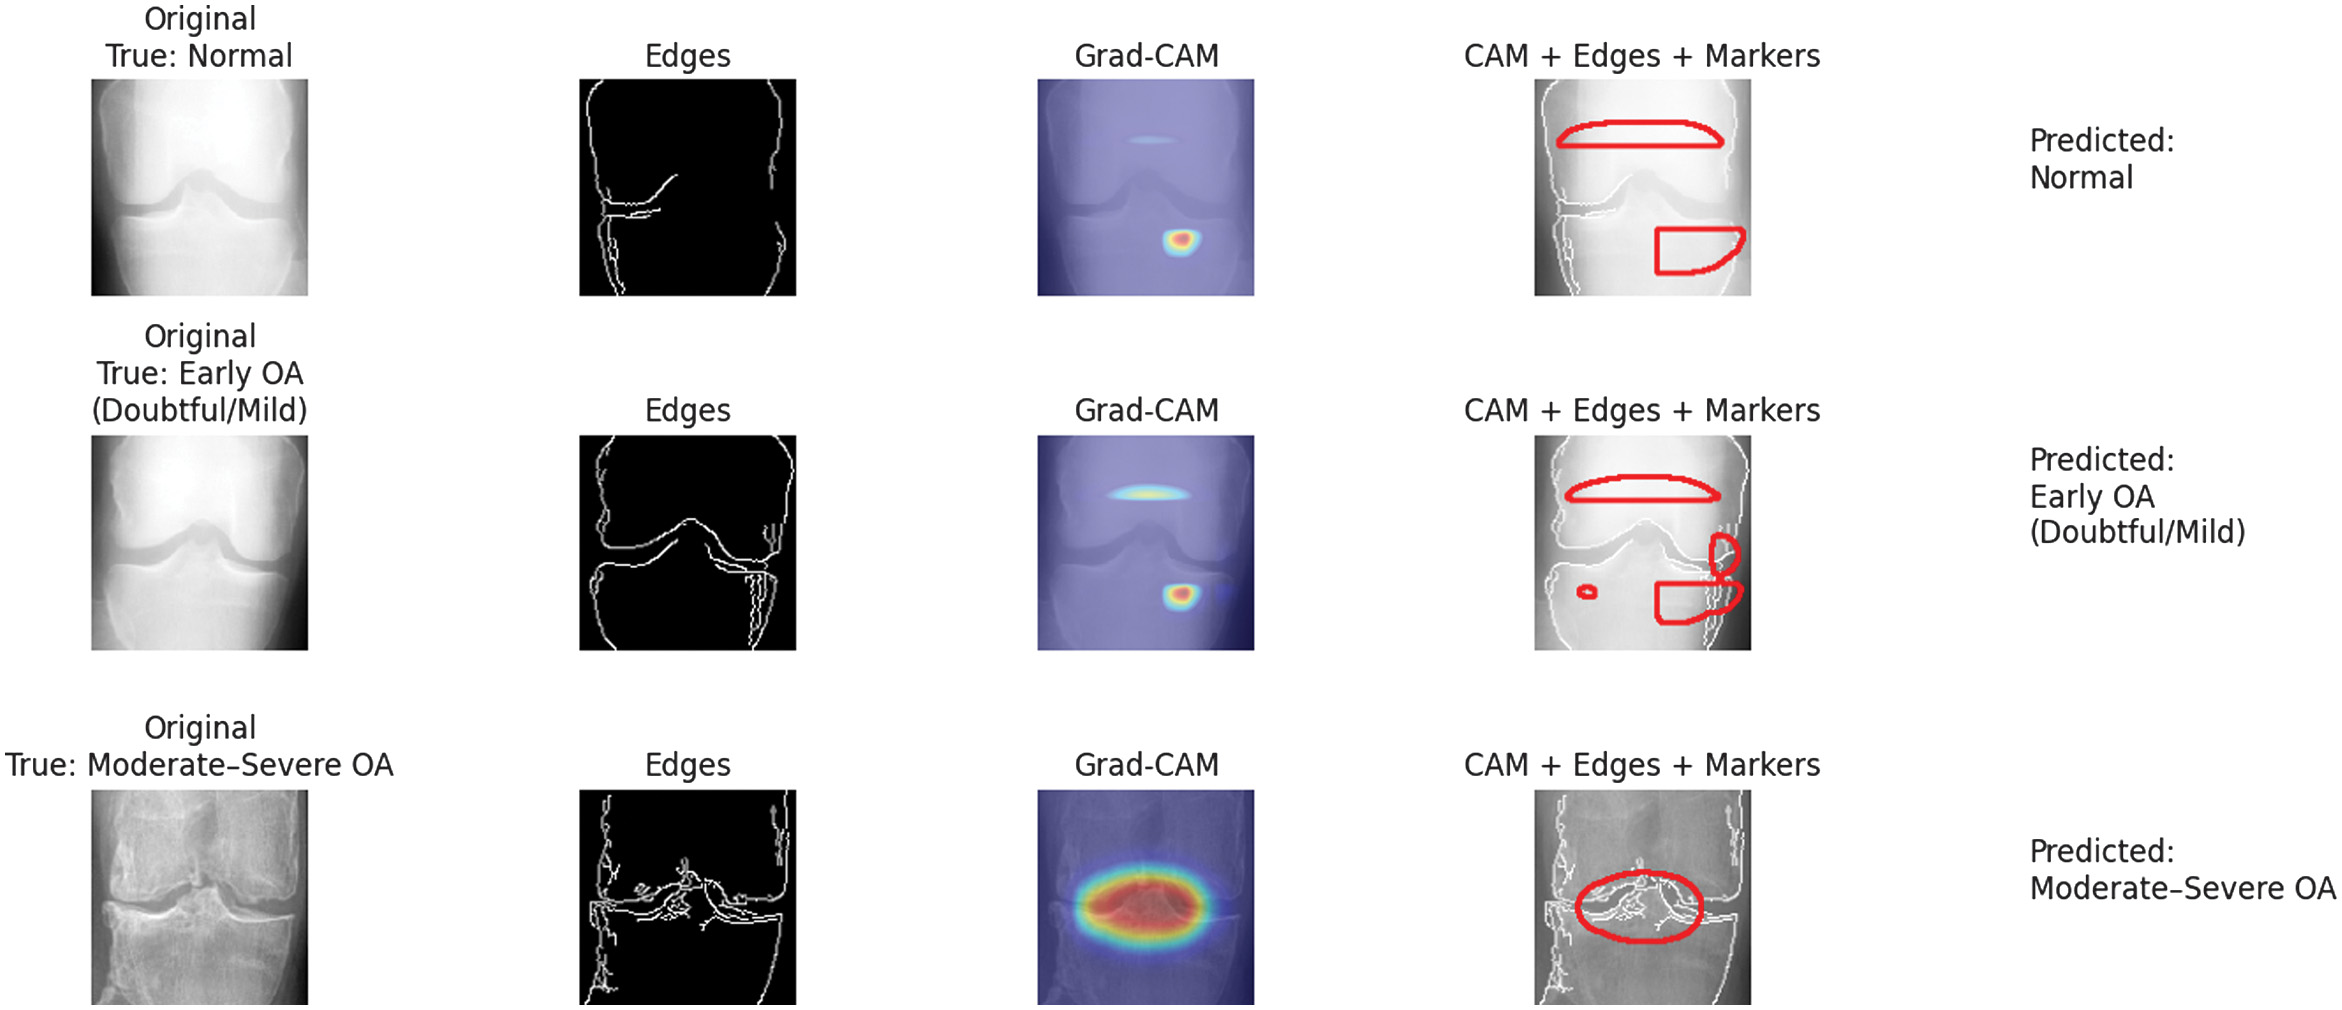 Fig. 7. Grad-CAM visualization highlighting regions influencing KOMMCF predictions for Normal, Early OA, and moderate–severe knee osteoarthritis cases.
D.EXPERIMENTAL RESULT
Table IV summarizes the average results across all folds using patient-level Group K-Fold cross-validation. The model achieved mean accuracies of 98.20%, 90.17%, and 80.82% for the 2-class, 3-class, and 5-class tasks, respectively, with corresponding QWK scores of 0.9624, 0.8971, and 0.9109.
- I.Cross-Validation Performance (Validation Set, n = 1154)
- Validation Set Classification Reports (Final Fold Average):
- •2-Class: 99% accuracy, perfect Normal OA separation
- •3-Class: 93% accuracy, macro-F1 0.90
- •5-Class: 84% accuracy, macro-F1 0.80
- II.Independent Test Set Performance (n = 1656)
Table IV. Group K-Fold cross-validation results
| Classification | Mean accuracy | Std Dev | 95% CI | Mean QWK | Std QWK |
|---|---|---|---|---|---|
| 2-Class | 98.20% | ± 0.70% | [96.83%, 99.57%] | 0.9624 | ± 0.015 |
| 3-Class | 90.17% | ± 1.04% | [88.14%, 92.20%] | 0.8971 | ± 0.011 |
| 5-Class | 80.82% | ± 1.39% | [78.10%, 83.55%] | 0.9109 | ± 0.007 |
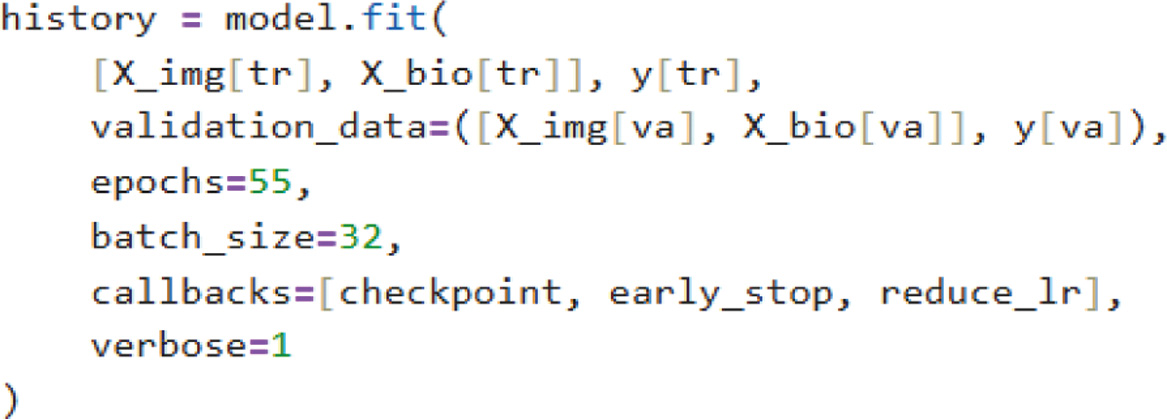
Training was conducted for 55 epochs and remained relatively stable, with minimal overfitting observed in the accuracy and loss. KOMMCF achieved high precision, recall, and F1-scores for both Normal OA and Abnormal OA cases, with a test-set macro F1-score−0.9860 and an overall accuracy−98.67% for binary classification. For three-class classification, the model attained an overall test accuracy−90.58% with a macro-average F1-score−0.8683, while for five-class classification, it attained an overall test accuracy−81.34% and a macro-average F1-score−0.7119.
The classification performance for the two-class, three-class, and five-class severity setting on the test dataset is summarized in Table V, and ROC curve for the same is shown in Table VI.
Table V. Classification reports of test data
| 2 – Classes | |
| 3 – Classes | |
| 5 – Classes |
Table VI. ROC curves of test data
E.COMPARISON RESULT
During our survey, we also studied several other multi-modal approaches, and the proposed KOMMCF model outperforms other approaches by 5–7% in accuracy and 0.05 in AUC, with a notable improvement in early-stage KOA detection sensitivity.
The KOMMCF model achieved finest in terms of accuracy, precision, recall, and F1-score; thus, it is the most robust approach in this study. MMLM [15] obtained 83. 45% accuracy and was the second-best model among all tested. MF_DIKO models [17] were evaluated in 3-class, 4-class, and 5-class settings with accuracy ranging from 67% (3-class) to 51% (5-class) showing poorer performance as classification complexity increases. The summary of this comparison is highlighted in Table VII.
Table VII. Comparison with other novel multi-modal approaches
| Macro-AVG | ||||
|---|---|---|---|---|
| Multi-modal approach | Accuracy% | Precision% | Recall% | F1-Score% |
| MMLM(3-classes) [ | 83.45 | 79.27 | 82.04 | 84.83 |
| MF_DIKO(3-classes) [ | 67 | 60 | 57 | 57 |
| MF_DIKO(4-classes) [ | 64 | 53 | 52 | 52 |
| MF_DIKO(5-classes) [ | 51 | 42 | 43 | 41 |
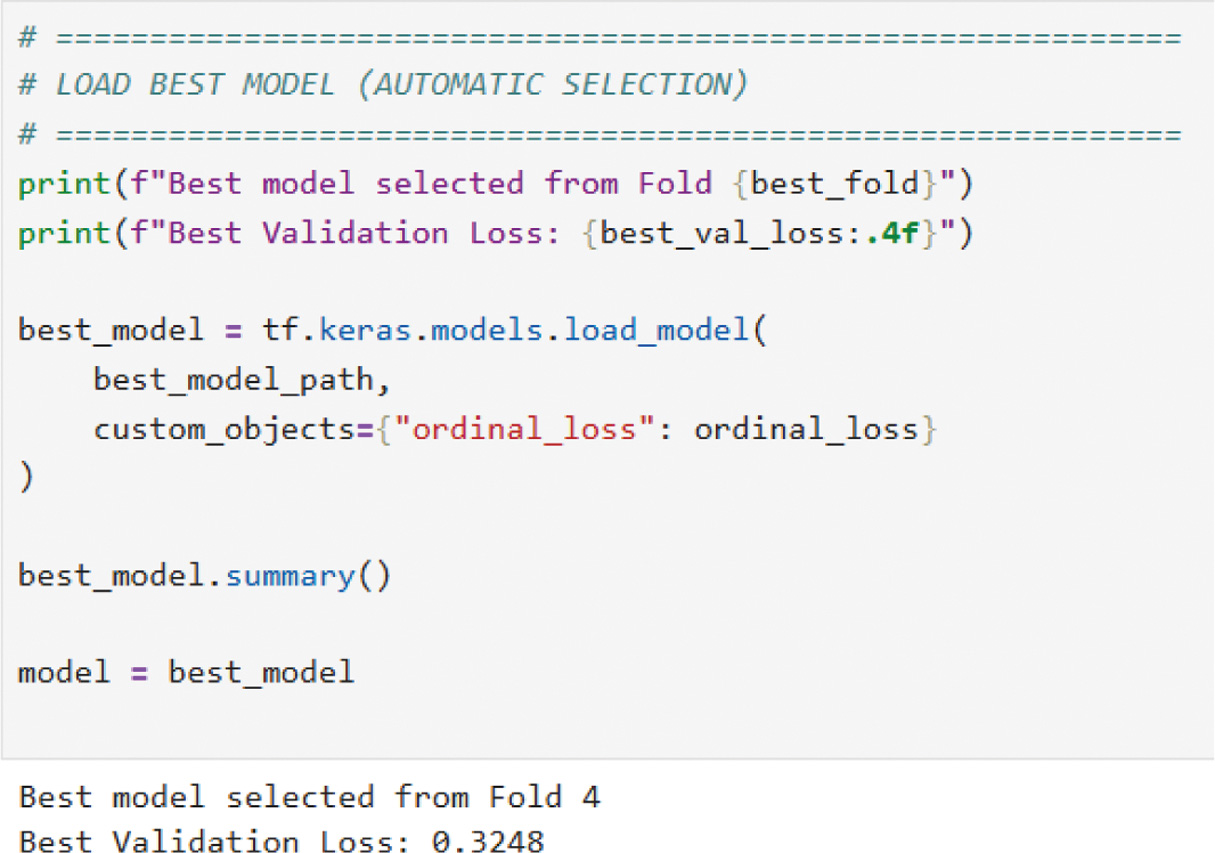
In addition, ResNet50, VGG16, and MobileNetV2 were trained on the fusion-processed data to evaluate their performance. All baselines used identical patient-wise splits and training protocol. Validation loss comparison is shown in Table VIII.
Table VIII. Validation loss comparison of our KOMMCF model with ResNet50, VGG16, and MobileNetV2
Summarization of the comparative precision, recall, and F1-score trends for the 2-class, 3-class, and 5-class KL grading is shown in Figs. 8, 9, and 10, and classification report is shown in Table IX.
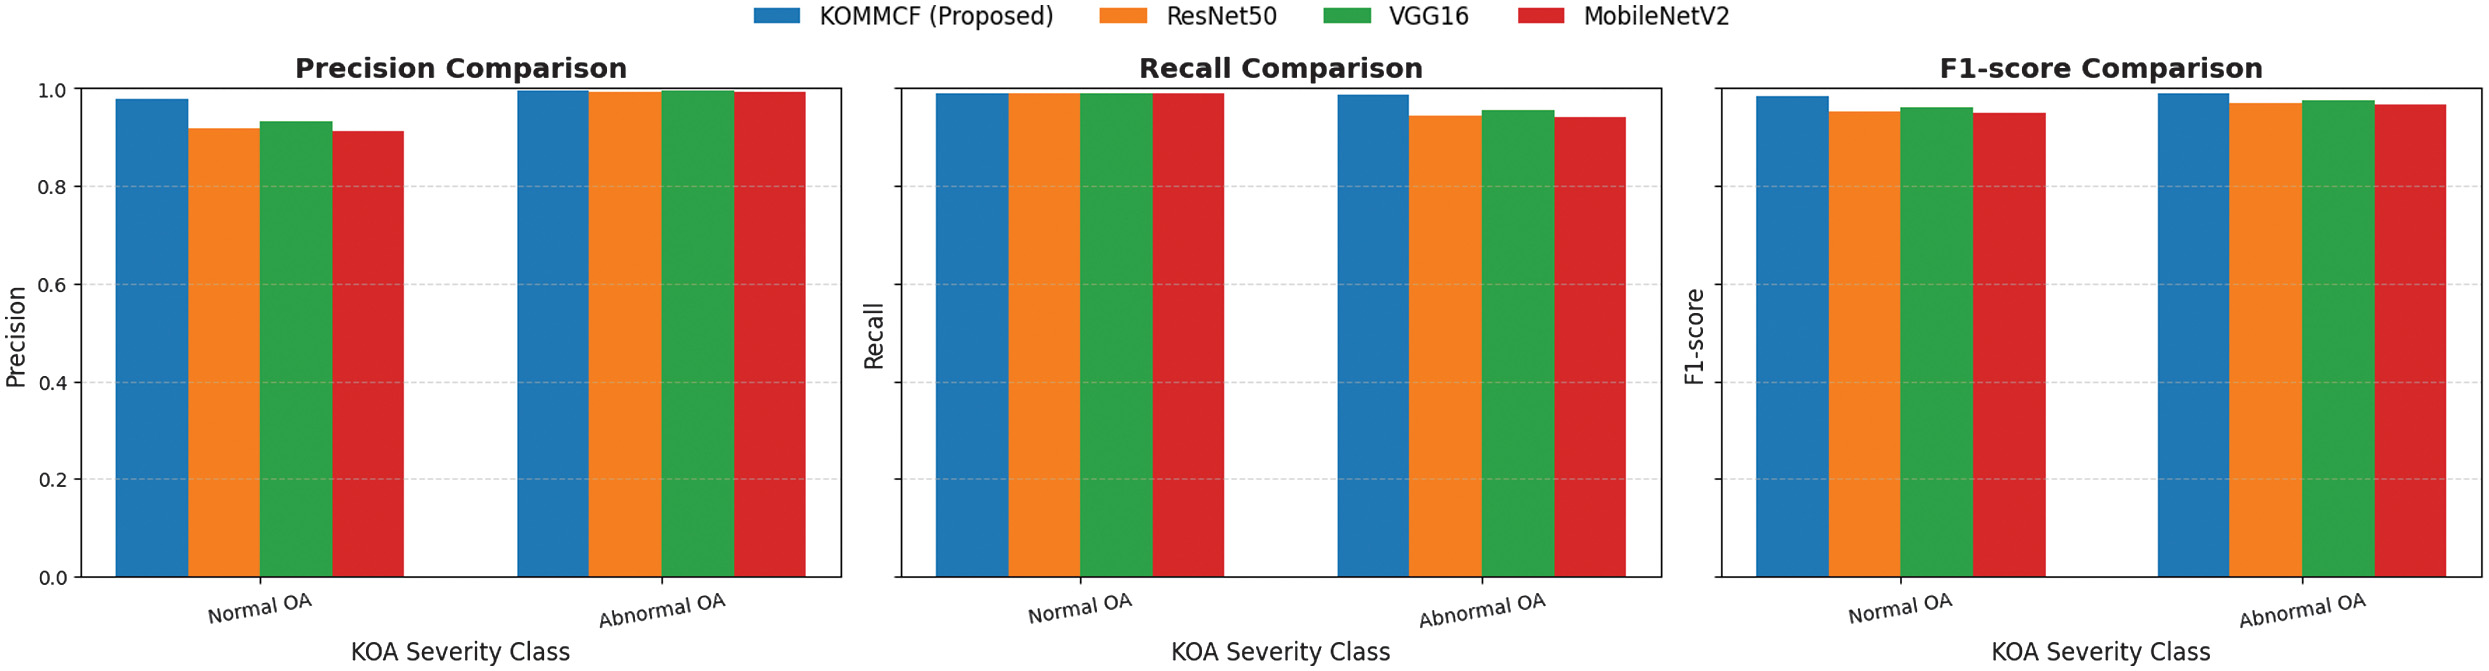 Fig. 8. Comparative analysis of precision, recall, and F1-score for different models (ResNet50, VGG16, MobileNetV2, and Custom CNN) across three KOA (Knee Osteoarthritis) classification categories: Normal and abnormal.
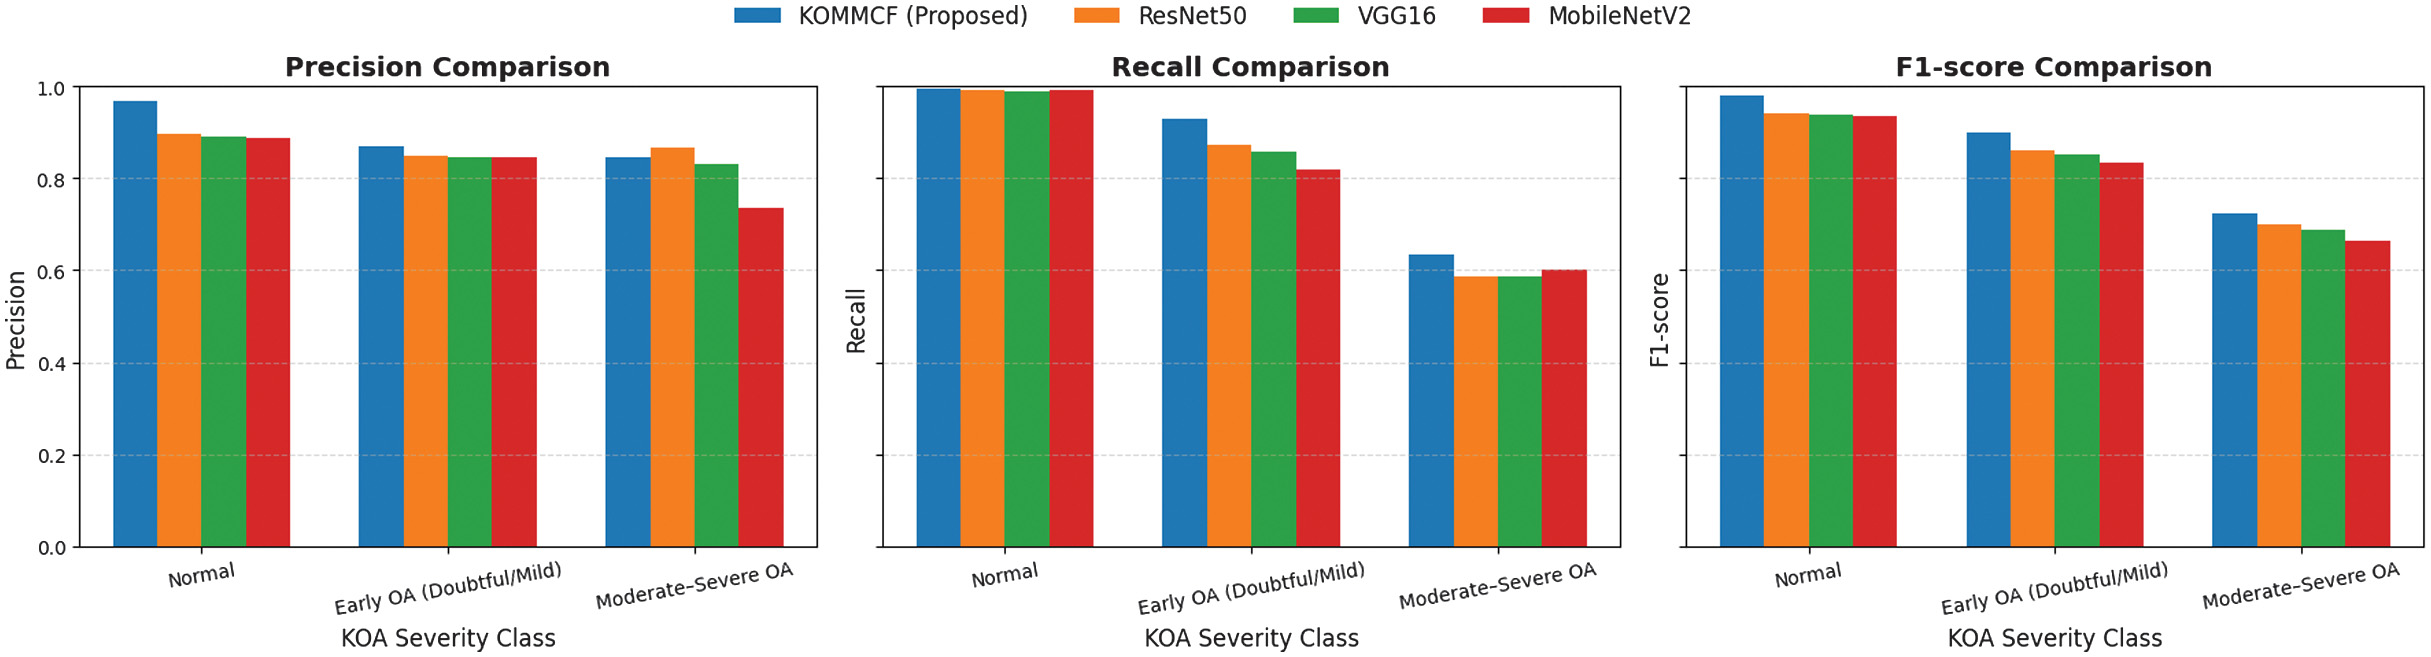 Fig. 9. Comparative analysis of precision, recall, and F1-score for different models (ResNet50, VGG16, MobileNetV2, and Custom CNN) across three KOA (Knee Osteoarthritis) classification categories: Normal, doubtful/mild, and moderate/severe.
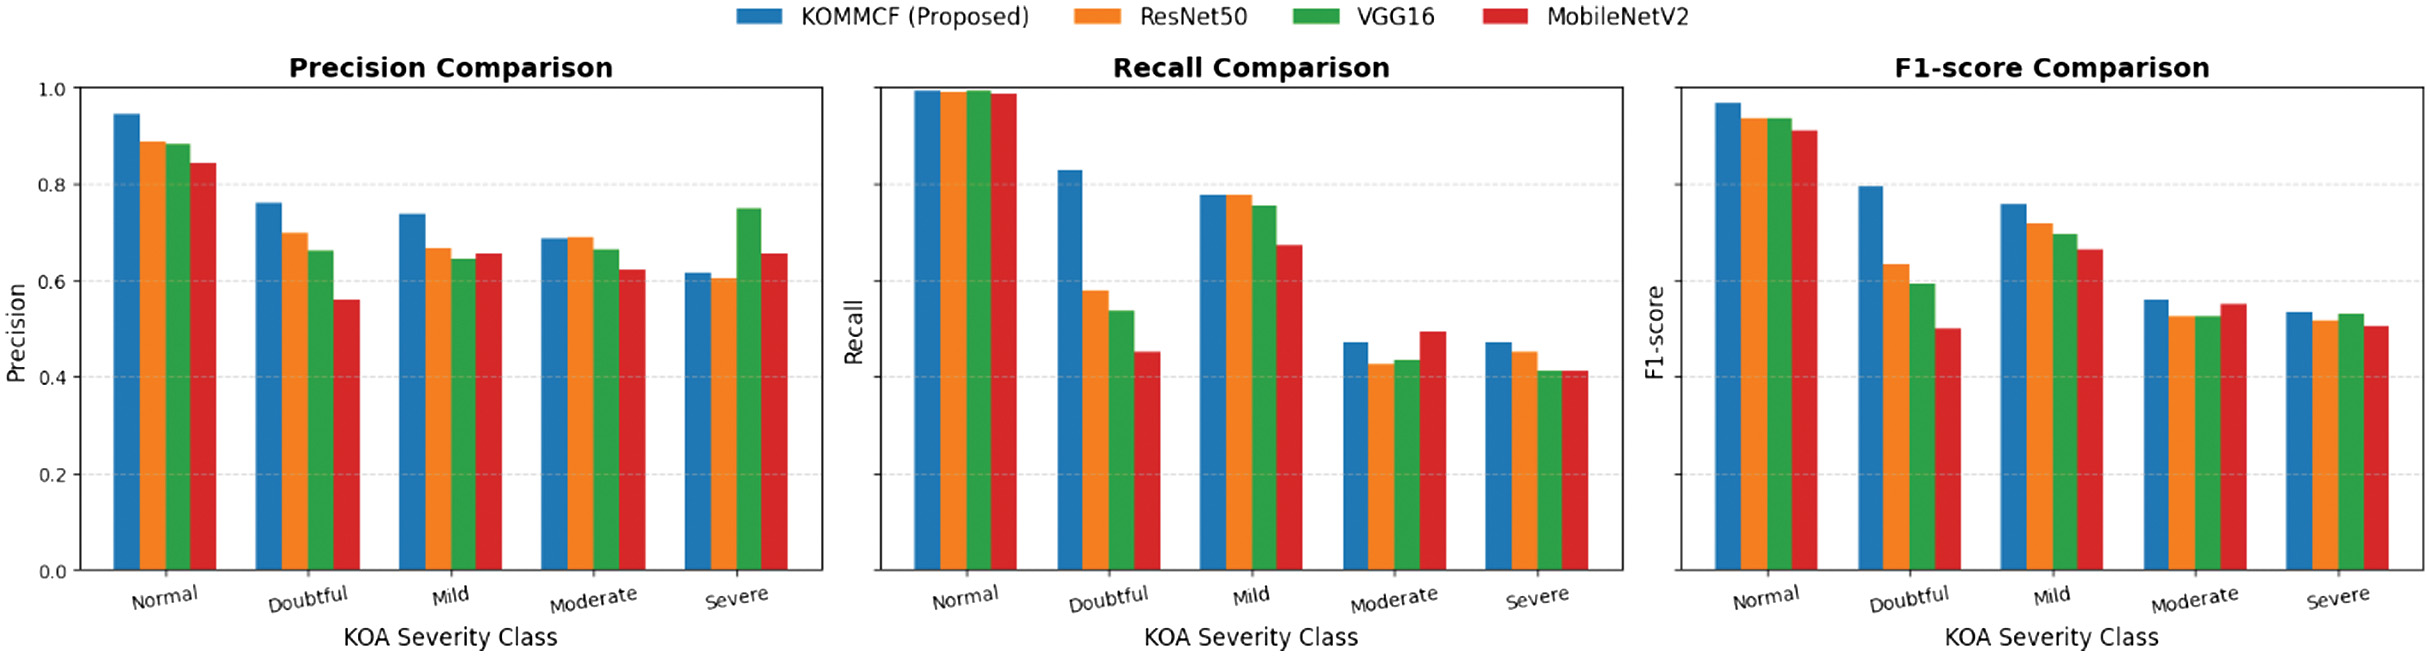 Fig. 10. Comparative analysis of precision, recall, and F1-score for different models (ResNet50, VGG16, MobileNetV2, and Custom CNN) across three KOA (Knee Osteoarthritis) classification categories: Normal, doubtful, mild, moderate, and severe.
Table IX. Classification report comparison of KOMMCF model with ResNet50, VGG16, and MobileNetV2
| Models | Accuracy% | Precision% | Recall% | F1-score% | |
|---|---|---|---|---|---|
| ResNet50 | 96.20 | 95.57 | 96.70 | 96.04 | |
| VGG16 | 96.86 | 96.31 | 97.27 | 96.72 | |
| MobileNetV2 | 95.95 | 95.30 | 96.50 | 95.79 | |
| ResNet50 | 87.14 | 87.06 | 81.72 | 83.42 | |
| VGG16 | 86.35 | 85.57 | 81.13 | 82.58 | |
| MobileNetV2 | 84.96 | 82.38 | 80.42 | 81.07 | |
| ResNet50 | 76.63 | 70.89 | 64.45 | 66.57 | |
| VGG16 | 75.36 | 72.06 | 62.60 | 65.58 | |
| MobileNetV2 | 72.22 | 66.67 | 60.33 | 62.56 | |
Table X. Statistical significance analysis (McNemar’s test)
| Comparison | χ2 | p-value | Significance | ||
|---|---|---|---|---|---|
| 2-classes | 3-classes | 5-classes | Same for all classes | Same for all classes | |
| KOMMCF vs ResNet50 | 31.13 | 25.09 | 31.14 | < 0.001 | Significant |
| KOMMCF vs VGG16 | 16.98 | 31.32 | 42.40 | < 0.001 | Significant |
| KOMMCF vs MobileNetV2 | 31.64 | 46.76 | 76.34 | < 0.001 | Significant |
To validate whether the observed improvements were statistically significant, McNemar’s test was conducted between KOMMCF and each baseline model across all classification settings. In all cases (2-class, 3-class, and 5-class), the p-value was< 0.001, indicating that the performance differences are statistically significant and not due to random chance. Statistical significance analysis (McNemar’s test is summarized in Table X).
The consistently high χ2 values further confirm that KOMMCF provides a meaningful and reliable improvement over conventional CNN architectures. Overall, the KOMMCF model is the most effective among all the models and achieves better than all other models, including DL models such as ResNet50, VGG16, and MobileNetV2, and other models such as MF_DIKO.
IV.CONCLUSION AND FUTURE WORK
KOMMCF is an innovative and efficient model for the classification of knee OA, based on the combination of X-ray image and clinical and biomarker information, the fusion of multi-modal features, and the use of an ordinal distance-aware loss function, while using patient-wise Group K-Fold cross-validation to avoid data leakage. Our study gave high priority to the three-class severity classification model (Normal, Early, and Moderate-Severe) with test accuracy of 90.58%, corresponding to the decision-making criteria used in the medical field. Additionally, the efficiency and generality of the proposed model were validated through its adaptation to the two-class (98.73% accuracy) and five-class (81.34% accuracy) classification problems. Moreover, the results of the McNemar’s test validated the model statistically, and they showed that the proposed model is significantly better compared to the conventional models of ResNet50, VGG16, and MobileNetV2 for all severity levels (p < 0.001). Lastly, the use of the Grad-CAM visualization technique enhanced the model interpretability. It ensures the interpretability of the results of the model by identifying the regions of the X-ray image with high importance to the classification process, and this increases the clinical validity and applicability of the model to real medical problems.
Some limitations remain. The model misclassified doubtful/mild (KL 1&2) cases, and further improvements are needed to discriminate early OA cases. As the model had difficulties with doubtful/mild OA cases, future work will combine higher resolution imaging techniques such as MRI scans with X-rays to detect understated structural variations in early OA. Advanced self-supervised learning methods and contrastive learning should be explored to improve feature discrimination between mild and moderate OA cases. We aim to develop this framework into a real-time clinical decision support system to assist radiologists in high-volume settings, reducing manual diagnostic errors and streamlining patient treatment planning.