I.INTRODUCTION
Coronavirus disease of 2019 (COVID-19) is a life-threatening virus impacted through Severe Acute Respiratory Syndrome Coronavirus 2 (SARS-CoV-2), leads to respiratory illness [1]. In accordance with the World Health Organization (WHO), there are over 611 million confirmed COVID-19 infections, resulting in more than six million deaths [2]. The symptoms of COVID-19 include fatigue, breath shortness, fever, and smell or taste loss. In certain cases, the infection leads to severe respiratory difficulties and pneumonia, requiring hospitalization and continuous admission to intensive care units (ICUs) [3]. Both COVID-19 and pneumonia can be life-threatening for individuals with chronic diseases. The primary diagnostic device to COVID-19 is reverse transcription polymerase chain reaction (RT-PCR). Due to an absence of specific treatments for COVID-19, early disease detection and immediate isolation of affected patients are crucial [4,5]. Developments in medical diagnosis tools named magnetic resonance imaging (MRI), computed tomography (CT), and X-rays are the most effective tools for early disease diagnosis [6,7]. Chest X-ray (CXR) scans support early diagnosis of suspected cases, with imaging of various viral pneumonia diseases overlapping with other lung illnesses [8]. Based on these findings, numerous studies are being conducted to automatically diagnose CT and X-ray images using image processing and artificial intelligence (AI) approaches [9,10]. A key aim of AI approaches is to automatically identify the inherent features of the data by using algorithms such as active learning (AL) methods [11,12]. Deep learning (DL) approaches enable automatic feature extraction through convolutional operations on input images at lower layers, allowing the strengthening of individual characteristics at higher levels [13,14]. Conventional approaches, namely convolutional neural networks (CNNs), entail large-scale datasets for efficient feature extraction and classification [15].
However, classical classification models struggle to capture the complex pixel relationships between images due to their inability to handle nonlinearities. Hence, this work proposes the Regularization-Aware EfficientNetB7 (RAE-NetB7) approach for CXR diseases classification. This method ensures better accuracy in classification tasks by effectively learning complex patterns and features from the data. In COVID-19 diagnosis, various researchers work with CXR datasets containing different classes and varying numbers of images. This research discusses the existing works on COVID-19 classification using COVID-19 radiography dataset and highlights their advantages and limitations.
A novelty of this research lies in the integration of an RAE-NetB7 architecture for CXR disease classification. Unlike conventional regularization techniques, the proposed strategy dynamically adjusts regularization strength during training through a softmax-based formulation, enhancing model generalization and preventing overfitting. Additionally, the framework employs a three-stage pipeline that combines Neural Architecture Search Network (NASNet) for robust feature extraction, Dynamic Probabilistic Elitist-based Ant Colony Optimization (DPE-ACO) for optimal feature selection, and the EfficientNetB7 classifier. This combination not only ensures efficient learning from relevant features but also improves classification performance significantly.
- •The data augmentation technique enhances the COVID-19 radiography dataset for more effective CXR disease classification, improving the model’s generalization by exposing it to diverse training images.
- •The pretrained NASNet architecture efficiently extracts meaningful features, supporting various image recognition tasks and minimizing training time.
- •The DPE-ACO approach is performed to select the appropriate features, effectively improving classification accuracy by identifying an optimal feature space.
- •The RAE-NetB7 approach is proposed for classifying CXR diseases into four classes, leveraging its capability to understand large features and patterns.
The research paper is further organized as follows: Section II offers the proposed method, Section III explains the classification process carried out using RAE-NetB7, Section IV offers results and discussion, and Section V concludes the research.
II.LITERATURE REVIEW
This section describes the existing works related to chest disease classification using various DL approaches, along with their advantages and limitations. Celik [16] developed the DL approach for fast COVID-19 detection. COVID-19 Detection using Feature Reuse Residual Blocks and Depthwise Dilated Convolutional Neural Network (CovidDWNet) was introduced with the help of the Feature Reuse Residual Block (FRB) structure and Depth-wise Dilated Convolutions (DDC) components. Furthermore, feature maps acquired through CovidDWNet were evaluated with a gradient boosting (GB) approach. FRB and DDC effectively extracted several features in CT images, enhancing detection performance. However, AlexNet performed worse than the other methods due to its limited ability to capture complex patterns and hierarchical features in the data. Hossain et al. [17] presented a transfer learning (TL) approach with a fine-tuned ResNet50 CNN for COVID-19 classification from CXR images. The model used iNat2021_Mini_SwAV_1k, which was fine-tuned through ResNet50 TL and pretrained on the Swapping Assignments between Views (SwAV) algorithm. The ResNet50 was modified by extending two fully connected (FC) layers to apply fine-tuning for the classification of CXR samples. The models used for classification outperformed those trained on ImageNet and demonstrated great potential with enhanced diagnostic accuracy. Nevertheless, the approach failed to extract important features, leading to an increase in false negatives and false positives.
Arora et al. [18] introduced various DL approaches, which were fine-tuned through the utilization of max-pooling overlapping in each network, while some used average pooling to minimize the overfitting problem. A fine-tuning method was introduced by extending the decision layers in the DL approach to match the number of layers and parameters used in feature extraction. This approach ensured that the model’s outcomes were evaluated consistently based on the extracted features. However, feature selection was not performed in this study to identify meaningful features, leading to poor performance. Islam et al. [19] implemented an automatic COVID-19 detection approach using a deep CNN called COV-RadNet, analyzing CXR and CT images. The TL approach was applied with the help of multiple DL models, such as Visual Geometry Group 16-layer (VGG16), VGG 19-layer (VGG19), Residual Network with 152 Layers (ResNet152), and Residual Network (ResNest), for COVID-19 detection. The data augmentation technique was used to balance the dataset and enhance the robustness of the classifier. Nevertheless, COV-RadNet struggled to generalize to diverse populations beyond those encountered during training, potentially leading to reduced accuracy. Li et al. [20] presented the Computer-Aided Diagnosis (CAD) approach of Cov-Net for effective diagnosis of COVID-19 using CXR images. An embedding approach of Modified ResNet, combined through asymmetric convolution and an attention function, was chosen to support the feature extraction process. Additionally, skip-connected dilated convolutions through various dilation rates were utilized for obtaining effective feature fusion between high-level semantic data and low-level comprehensive data. This approach improved generalization capabilities by performing feature fusion. Nevertheless, redundant data were not effectively addressed in either feature learning or fusion approaches, leading to less accurate results.
Qiang Li et al. [21] implemented a Multi-Level Residual Feature Fusion Network (MLRFNet) for classification of thoracic diseases. An implemented approach rapidly models the approachable data over various lesion sizes and improves the disease-related feature maps. The MLRFNet involved the different characteristics, such as the feature extraction method that learned multi-scale semantic data and the Multi-level Residual Feature Classifier (MRFC), which refined the disease-related pathological features at spatial positions for the minimization of interference from inappropriate areas. The Efficient Channel Attention (ECA) mechanism merged both components to allow flexible concentration on complex pathological data.
Marriam Nawaz et al. [22] introduced the DL method for chest disease detection via the EfficientNet (CXray-EffDet) approach. Obviously, the EfficientNet-B0-assisted EfficientDet-D0 approach for the computation of a consistent set of instance features also accomplished the detection and classification task by classifying different classes of chest diseases. CX-ray-EffDet approach improved energy-efficient recognition because of its higher recall rate and robust detection strategy.
Faisal Alshanketi et al. [23] provided a detailed analysis of DL framework for pneumonia detection, with the highlights on solving the issues caused through imbalanced datasets. An implemented method estimated the effectiveness of diverse DL approaches, such as VGG, ResNet, and Vision Transformers (ViT), in addition to mechanism for the mitigation of imbalanced dataset impact. Moreover, TL from a pretrained model of ImageNet was analyzed to leverage the prior skill for enhanced effectiveness on pneumonia detection operations. The semi-supervised learning method of the mean teacher approach was also identified for the effective utilization of unlabeled data.
From this overall analysis, the identified limitations of the previous models include the inability for modeling complex patterns and hierarchical features in the data, a lack of feature extraction, an absence of feature selection, poor generalization on unseen data, and ineffective handling of redundant data in feature learning and fusion approaches. Therefore, this research aims to solve these issues by proposing the RAE-NetB7 approach for the classification of CXR diseases.
III.PROPOSED METHOD
In this article, an RAE-NetB7 approach is proposed to effectively classify CXR diseases. This research consists of several key phases, as outlined below: data acquisition from the COVID-19 radiography dataset, preprocessing using data augmentation, feature extraction with NASNet, and feature selection using the ACO approach. Finally, classification is performed using the RAE-NetB7 technique. Figure 1 specifies the development of proposed methodology.
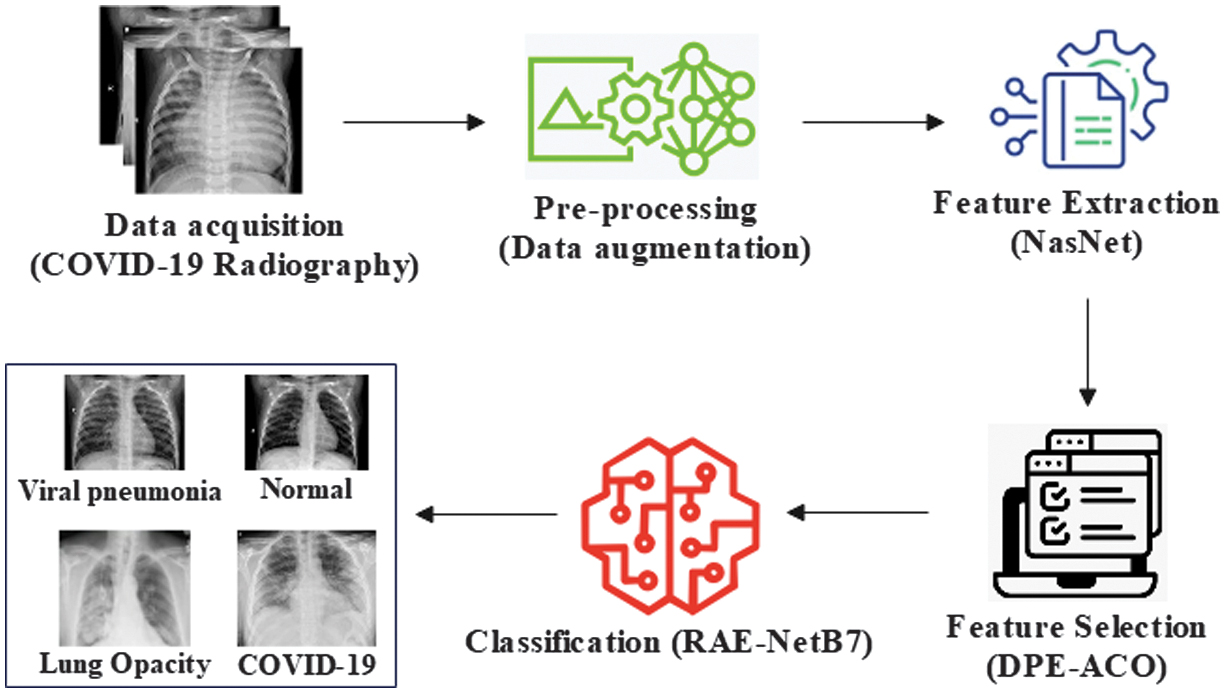 Fig. 1. Development of the proposed methodology.
A.DATA ACQUISITION
This research utilizes the COVID-19 radiography dataset [24], CXR class 14 (CXR14) [25], and CheXpert [26] to conduct experiments with the proposed approach.
The acquired COVID-19 radiography dataset consists of different categories. Table I presents the sample numbers in the COVID-19 radiography dataset. Figure 2 illustrates the sample images from the dataset. The collected dataset is then passed to the preprocessing step to improve model effectiveness.
Table I. Number of samples of COVID-19 radiography
| Classes | COVID-19 | Viral pneumonia | Lung opacity | Normal | Total |
|---|---|---|---|---|---|
| No. of samples | 3616 | 1345 | 6012 | 10192 | 21165 |
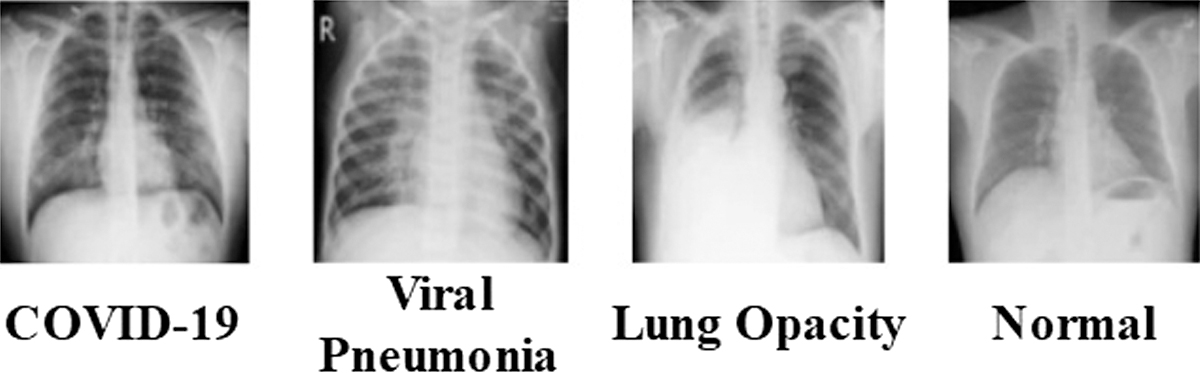 Fig. 2. Sample images of the COVID-19 radiography.
The CXR14 dataset involves frontal-view X-ray samples from 14 experts. Excluding 60,361 samples labeled “No finding,” every sample is assigned to 14 experts, and 880 samples are annotated through 984 labeled bounding boxes for different pathology types.
The CheXpert dataset involves 224,316 X-ray images of 65,240 patients through 14 remarks extracted from medical records. Every remark is applied as positive (1), negative (0), or uncertain (−1). An estimation set of this dataset involves various board-certified radiologists.
B.PREPROCESSING
The images collected from the dataset are preprocessed through a data augmentation technique to enhance sample counts. However, the dataset faces the class imbalance problem due to a varying number of images, which potentially causes misclassification and less accurate results. To address this, data augmentation is employed to balance the dataset and enhance the performance. The data augmentation technique [22] extends training instance counts; however, the lack of constraints on the COVID-19 classes significantly exacerbates the data imbalance issue, resulting in poor accuracy. Data augmentation includes operations such as rotation, width shift, height shift, shear, zoom, brightness adjustment, horizontal flipping, and vertical flipping to expand the input data. Table II presents the hyperparameters of the data augmentation process for the proposed method. By performing these transformations, the data are balanced across all classes. Data augmentation is utilized only for the training subset after the dataset is split into training and testing. No augmented samples are applied for test sets, ensuring that data leakage and near-duplicate image bias are completely avoided. Then, the augmented data are forwarded for feature extraction.
Table II. Hyperparameters of the data augmentation
| Parameters | Values |
|---|---|
| Rotation | 30° |
| Height shift | 0.2 |
| Width shift | 0.2 |
| Zoom | 0.2 |
| Horizontal flipping | True |
| Vertical flipping | True |
C.FEATURE EXTRACTION
The augmented images are used as input for extracting meaningful features. The collected dataset contains various irrelevant and redundant features, and without extracting the relevant ones, the classification performance is hindered. Therefore, to extract relevant features, a pretrained NASNet architecture is employed in this research. Compared to various other pretrained models, NASNet enables the extraction of rich and robust features from images, which is particularly useful for CXR classification, where subtle differences in image features can indicate different diseases. A detailed explanation of NASNet is provided below.
1).NASNet ARCHITECTURE
NASNet [23] is a neural network architecture trained on over a million images from ImageNet. It is capable of classifying a single image into a thousand different object categories. As a result, the network learns to distinguish between rich feature representations and image variations, with the input image size set to pixels. The secondary component extracts the feature by eliminating the FC layer. NASNet is based on a block architecture that does not rely on predetermined features, instead using a reinforcement learning (RL) search method for feature identification. It employs two types of cells such as normal and reduction. A normal cell contains a convolutional layer that produces a feature map of the same dimensions as the input, while the reduction cell includes a convolutional layer that reduces the feature map by half in both width and height. The NASNet architecture is then used as the feature extractor, with three key parameters: the primary parameter sets the value to ImageNet, and the secondary parameter, called “include_top,” determines whether the FC layer is included. For feature extraction, the “include_top” parameter is set to False to extract features at the final layer. NASNet is exclusively utilized for feature extraction in this research. The FC layers of NASNet are removed, and the output from the final convolutional block is flattened to acquire a deep feature vector of 1,056 dimensions for each input image. These extracted features serve as an input to the feature selection and classification stages. EfficientNetB7 is not used as a full convolutional backbone in this work; instead, a customized EfficientNetB7-inspired classification head composed of FC layers with adaptive regularization is applied to the selected deep feature vectors.
D.FEATURE SELECTION
Here, the extracted features are used as input to select the relevant features. Feature selection supports a classifier to concentrate on significant data aspects, leading to improved accuracy by removing irrelevant features. Feature selection is essential in medical image classification tasks to enhance both model performance and efficiency. Deep feature extractors, namely NASNet, often generate high-dimensional data containing redundant or irrelevant information, which hinders classification accuracy. This process also helps prevent overfitting, particularly in scenarios with limited or imbalanced datasets. Moreover, feature selection significantly reduces computational overhead, leading to faster training and inference times, which is crucial for real-time diagnostic applications. Additionally, a reduced and meaningful feature set improves the interpretability of the model’s decisions, designing it more suitable for clinical utilization.
By selecting a minimal subset of important features, the method’s performance is enhanced. Compared to other algorithms, the adaptability of the ACO approach allows it to effectively identify complex feature spaces and adjust to different datasets and problems, making it versatile for various CXR classification tasks.
1).DYNAMIC PROBABILISTIC ELITIST-BASED ANT COLONY OPTIMIZATION
The DPE-ACO is selected over conventional optimizers, such as Genetic Algorithm (GA), Whale Optimization Algorithm (WOA), and Artificial Bee Colony (ABC), due to its superior capability to harmonize exploration and exploitation in feature selection. Unlike other methods, DPE-ACO dynamically adjusts the pheromone update process by emphasizing the best-performing solutions in each iteration. This strategy helps identify the most relevant and informative features while reducing redundancy. As a result, it improves classification performance by focusing the model on meaningful data patterns. Its effectiveness makes it highly suitable for real-time medical diagnostic systems, where both accuracy and computational efficiency are critical. The ACO algorithm [24,25] mimics the foraging behavior of ants when searching for a route between a food source and an ant colony. To effectively capture this behavior, the initialization process is enhanced with a specific update rule that increases the likelihood of elitist updates. Here, the probability is defined as a model of the present best solution at the present iteration, which is formulated in Equation (1):
When , it indicates that present optimal tour distance is poor compared to the maximum global tour distance. In such cases, the value of from previous iterations is utilized. Initially, the greater global tour distance is inaccessible during the start of a solution, and the tour distance from the initial iteration is used as an estimate for the maximum global length. This estimation helps guide the search process and potentially minimizes the search space in subsequent iterations. This likelihood ensures that the initial iterations rely on pheromone updates from a standard, non-elitist method . Hence, the pheromone updates from the current best global tour are given greater importance than those from past iterations, enhancing the likelihood of elitist updates. Consequently, an elitist-based update strategy is applied, guiding the updates with a higher probability. Therefore, the dynamic probabilistic elitist method strikes a balance between exploration and exploitation. It uses a decreasing , which promotes more exploration at the beginning of the search with a lower and shifts toward exploiting the best tours as the search progresses. This targeted approach significantly enhances classification performance by utilizing all available features extensively. The reduction in feature dimensionality helps prevent overfitting and enhances an approach’s generalization abilities.
This research aims to improve classification accuracy, which is considered a fitness function, and also needs to minimize the number of features. This multi-objective function ensures that selected features contribute to improved model performance while reducing redundancy and adaptive optimization. The fitness calculation is demonstrated in Equation (2):
where specifies the total count of features in the Covid-19 radiography dataset, illustrates the total number of selected features, illustrates an error in classification through a feature subset, and denotes a respective weight value provided to a classification error, as well as the count of features. As a result of the DPE-ACO approach employed during feature selection, 843 features are selected. The selected 843-dimensional feature vectors obtained after DPE-ACO are classified using a customized EfficientNetB7-inspired FC classification head. Thus, EfficientNetB7 is adapted as a feature-based classifier rather than an image-level model.IV.CLASSIFICATION
During classification, the selected features are used as input to classify CXR images into four classes. The DL-based classification method achieves good performance even with a smaller number of training samples. For this, the RAE-NetB7 approach is proposed to enhance the classification process.
A.REGULARIZATION-AWARE EfficientNet B7
The proposed RAE-NetB7 significantly outperforms existing methods, such as CovidDWNet+GB, ResNet50, and DCNN-CoV-RadNet, which often lack robust feature extraction or effective feature selection. The regularization further enhances classification by learning the optimal weight constraints during training. This method enables accurate classification of CXRs. Its application is highly impactful in clinical environments, offering faster and more accurate diagnostic support. The model’s strength lies in its ability to handle complex image patterns and deliver consistent results across multiple disease conditions. EfficientNetB7 is a novel method for scaling CNNs that optimizes the network’s width, depth, and input data resolution. The architecture consists of seven distinct blocks, each containing varying numbers of Mobile Inverted Bottleneck Convolutions (MBConv), with each MBConv having filters of different sizes, strides, and channel configurations. This architecture follows a multi-scaling approach, where the depth, width, and resolution are modified with a balance between model size and computational effectiveness, establishing that the model maintains a finely balanced and optimized structure. EfficientNetB7 is further customized by extending the initial Global Average Pooling (GAP) layer that minimizes spatial dimensions of the feature map to a constant value for every channel. This reduction minimizes the number of parameters in the subsequent layers, thereby enhancing the computational efficiency. The GAP layer serves as a transitional step between the base model and the additional layers. Figure 3 demonstrates the framework of RAE-NetB7. In the proposed RAE-NetB7, the EfficientNetB7 backbone is used for hierarchical feature extraction through stacked MBConv blocks, pursued through a GAP layer that reduces spatial dimensions of the feature maps. After this pooling stage, a classification head combines an adaptive regularization mechanism. Specifically, the dynamically learned regularization factors are applied at this phase through modifying the loss function, ensuring that the penalty on weights is data-driven and updated during backpropagation.
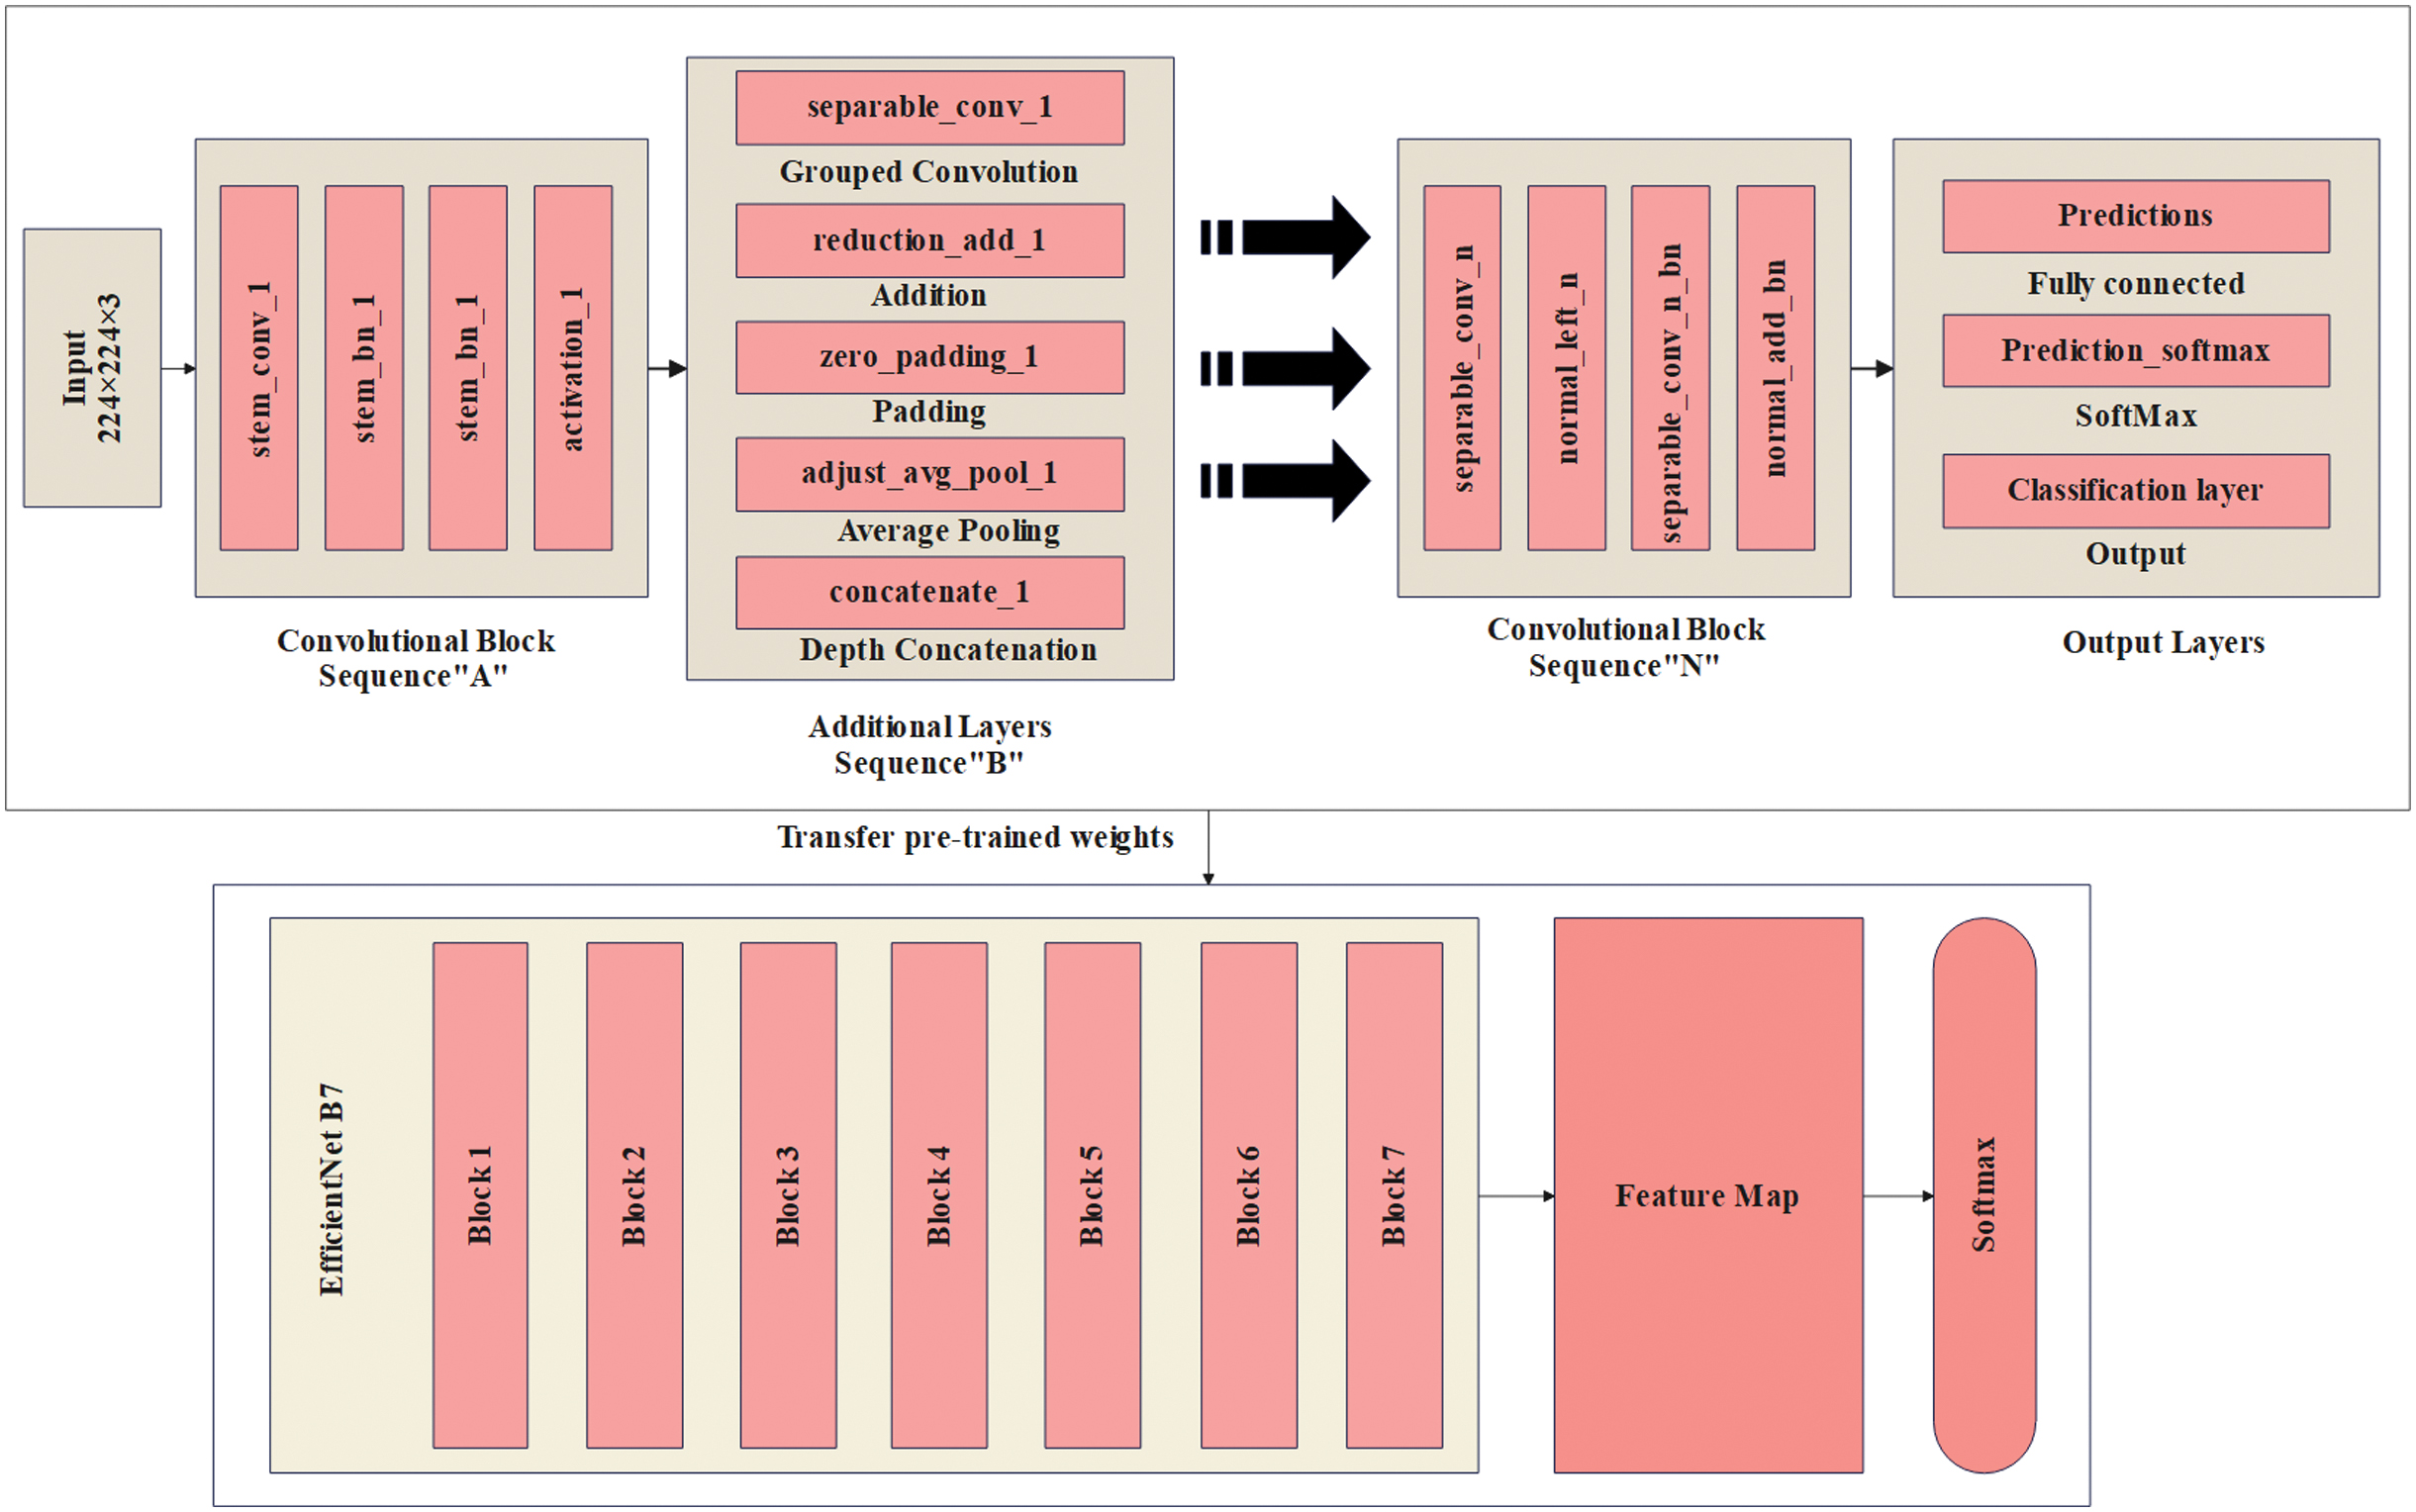 Fig. 3. Architecture of the RAE-NetB7.
Hence, as illustrated in Fig. 3, the regularization is present in the classification head, directly after the GAP layer and before the final FC and softmax layers. A neural network consists of a set of distinct parameters, as formulated in Equation (3). The classical Least Squares (L2) regularization introduces an additional penalty term to the objective function, as expressed in Equation (4):
where represents the array, which involves vectors, matrices, or tensors, while involves all the trainable parameters. and , respectively, signify the actual and updated objective functions. In this condition, represents the weighted sum of categorical cross-entropy and the triplet loss function. Furthermore, denotes the square of the L2 norm of , while a constant coefficient describes the regularization coefficient. Hence, it is further simplified by describing a unique coefficient for every , which is formulated in Equation (5):Where every parameter is associated with the actual regularization factor . It is impractical to manually adjust these regularization factors for sequentially. Hence, they are treated as learnable parameters, with the appropriate constants identified from the data individually. To design the regularization factor adaptively, the predetermined constant is modified upfront, and scalar variables are trained by backpropagation. Negative values for enhance , causing to be minimized immediately. On the other hand, regularization penalties override in the optimization scheme. As a result, the method fails to learn effective feature embeddings. Thus, this research performs the softmax activation function, which ensures that the regularization factor remains positive. The softmax activation function is formulated in Equation (6):
Here, denotes an input vector, denotes class counts, and signifies an output vector. A total of each value in value is equal to 1. The regularization factor is acquired using the softmax activation function on the raw parameters, as expressed in Equation (7):
Here, represents a trainable scalar variable. Additionally, the hyperparameter denotes an amplitude. Thus, it is formulated in Equations (8) and (9):
where denotes the regularized loss function, represents the actual loss function, demonstrates parameter counts, denotes a constant, and signifies the function applied to the parameter . By using RAE-NetB7, the model is effectively scaled in a balanced manner through compound scaling, optimizing the overall classification performance.In the proposed RAE-NetB7, regularization is achieved by an adaptive mechanism rather than a fixed penalty. In particular, every parameter in the network is assigned a learnable regularization factor, which is dynamically adjusted during training. A softmax-based formulation ensures that these factors remain positive and normalized, avoiding instability while allowing flexibility. This dynamic update is employed by backpropagation, allowing an approach to automatically enhance the penalty for parameters that risk overfitting while minimizing it for parameters that offer meaningful contributions to feature learning. A target objective function combines categorical cross-entropy and triplet loss with these adaptive penalties, ensuring a balance between accurate feature embedding and controlled weight growth. This design eliminates both under- and over-regularization, thus enhancing generalization on unseen CXR data compared to conventional fixed L1/L2 regularization.
Then, the classified results are experimented on to evaluate the model’s effectiveness.
V.RESULTS AND DISCUSSION
The performance of the proposed RAE-NetB7 approach is tested and validated using the COVID-19 radiography dataset. The proposed RAE-NetB7 method is implemented in a Python 3.10.12 environment, with the system specifications being Windows 10 OS, 64-bit RAM, an Intel Core i5 processor, and 8 GB RAM. The training and testing is partitioned into a ratio of 80:20. In the training, an input image is set to for attaining an effective approach’s importance. The Bayesian optimization is employed to tune hyperparameters such as learning rate and dropout ratio, while the Adam optimizer is used for updating network weights during training, and an initial learning rate is fixed at 0.001. Subsequently, the learning rate is decreased to 0.0001 every 100 epochs based on the validation error. This research leverages the dropout ratio of 0.5 in FC layers. The proposed method is assessed in terms of the metrics: accuracy, precision, sensitivity/recall, and F1-score. The mathematical expressions of metrics are provided using Equations (10) to (13):
Here, , , , and denote true positive, true negative, false positive, and false negative, respectively. Table III presents the hyperparameter settings of the proposed RAE-NetB7 approach.
Table III. Hyperparameter settings of the proposed RAE-NetB7
| Hyperparameters | Values |
|---|---|
| Image size | |
| Batch size | 32 |
| Regularization learning rate | 0.1 |
| Loss | Categorical cross-entropy |
| Optimization | Adam, Bayesian |
| Activation function | Softmax |
A.PERFORMANCE ANALYSIS
The proposed RAE-NetB7 approach is compared with the existing methods using the COVID-19 radiography dataset. Tables IV–VI present performance analysis of feature extraction, feature selection, and classification results.
Table IV. Analysis of feature extraction results
| Dataset | Methods | Accuracy (%) | Precision (%) | Recall (%) | F-score (%) |
|---|---|---|---|---|---|
| COVID-19 | AlexNet | 96.66 | 97.28 | 97.65 | 97.46 |
| ResNext50 | 96.51 | 84.6 | 69.2 | 76.12 | |
| DenseNet121 | 91.98 | 88.87 | 85.84 | 87.32 | |
| NASNet | 99.53 | 98.92 | 99.10 | 99.00 | |
| CXR14 | AlexNet | 89.72 | 89.55 | 89.61 | 89.58 |
| ResNext50 | 92.14 | 92.05 | 92.11 | 92.08 | |
| DenseNet121 | 93.47 | 93.41 | 93.45 | 93.43 | |
| NASNet | 95.18 | 95.13 | 95.17 | 95.15 | |
| CheXpert | AlexNet | 87.43 | 87.25 | 87.31 | 87.28 |
| ResNext50 | 90.68 | 90.61 | 90.57 | 90.59 | |
| DenseNet121 | 91.96 | 91.88 | 91.90 | 91.89 | |
| NASNet | 93.38 | 93.39 | 93.37 | 93.38 |
Table V. Analysis of feature selection results
| Dataset | Methods | Accuracy (%) | Precision (%) | Recall (%) | F1-score (%) |
|---|---|---|---|---|---|
| COVID-19 | GA | 94.80 | 84.97 | 92.84 | 88.73 |
| WOA | 96.65 | 87.92 | 93.26 | 90.51 | |
| ABC | 96.24 | 93.26 | 87.92 | 90.51 | |
| DPE-ACO | 99.53 | 98.92 | 99.10 | 99.00 | |
| CXR14 | GA | 93.68 | 93.63 | 93.67 | 93.65 |
| WOA | 93.78 | 93.73 | 93.77 | 93.75 | |
| ABC | 93.58 | 93.53 | 93.52 | 93.52 | |
| DPE-ACO | 95.18 | 95.13 | 95.15 | 95.15 | |
| CheXpert | GA | 91.88 | 91.89 | 91.87 | 91.88 |
| WOA | 91.98 | 91.99 | 91.97 | 91.98 | |
| ABC | 91.78 | 91.79 | 91.74 | 91.76 | |
| DPE-ACO | 93.38 | 93.39 | 93.37 | 93.38 |
Table VI. Analysis of the classification results
| Dataset | Methods | Accuracy (%) | Precision (%) | Recall (%) | F-score (%) |
|---|---|---|---|---|---|
| COVID-19 | InceptionV3 | 91.91 | 95.54 | 95.54 | 95.54 |
| CNN | 94.00 | 93.00 | 93.00 | 93.00 | |
| VGG-19 | 97.75 | 96.33 | 97.12 | 97.72 | |
| RAE-NetB7 | 99.53 | 98.92 | 99.10 | 99.00 | |
| CXR14 | InceptionV3 | 92.84 | 92.76 | 92.69 | 92.72 |
| CNN | 91.72 | 91.65 | 91.53 | 91.59 | |
| VGG-19 | 93.67 | 93.61 | 93.52 | 93.56 | |
| RAE-NetB7 | 95.18 | 95.13 | 95.17 | 95.15 | |
| CheXpert | InceptionV3 | 90.43 | 90.41 | 90.36 | 90.38 |
| CNN | 89.36 | 89.31 | 89.25 | 89.28 | |
| VGG-19 | 91.22 | 91.19 | 91.11 | 91.15 | |
| RAE-NetB7 | 93.38 | 93.39 | 93.37 | 93.38 |
Table IV illustrates an estimation analysis of different feature extraction approaches on COVID-19 radiography dataset. The existing feature extraction approaches, namely AlexNet, ResNext50, and Densenet121, are compared with the NASNet feature extraction method. The NASNet achieves a higher detection accuracy when compared to other architectures by adjusting the search space and optimization criteria. The NASNet feature extraction approach achieves a superior accuracy of 99.53% as compared to previous approaches.
Table V displays the analysis outcomes for various feature selection approaches on COVID-19 radiography dataset. The existing classification approaches, namely GA, WOA, and ABC, are compared against that of the DPE-ACO algorithm. Compared to other methods, the ACO balances exploration and exploitation abilities by adjusting the pheromone levels based on the success of previous iterations, resulting in enhanced classification accuracy. The proposed approach obtains an outstanding accuracy of 99.53% as compared to other methods.
Table VI displays the analysis of various classification approaches on the COVID-19 radiography dataset. The existing classification approaches, Inception V3, CNN, and VGG-19, are compared with the RAE-NetB7 method. When compared to the other methods, the proposed RAE-NetB7 better helps prevent overfitting by penalizing large weights in the network and dynamically adjusting regularization strength based on the significance of the features.
Table VII specifies performance estimation of cross-fold validation of the proposed approach. It presents the results of k-fold cross-validation using different values of K (2, 4, 5, and 7) to evaluate robustness of the proposed approach. A best performance is achieved at K = 5, with an accuracy of 99.53%. This confirms that the model generalizes well without overfitting and that K = 5 offers the most balanced split between training and validation sets. Performance slightly declines at K = 2 and K = 7, indicating instability or underutilization of training data at lower or higher splits. Thus, K = 5 is chosen for all evaluations to ensure consistent and reliable model performance.
Table VII. Analysis of the k-fold analysis results
| Dataset | K values | Accuracy (%) | Precision (%) | Recall (%) | F-score (%) |
|---|---|---|---|---|---|
| COVID-19 | K = 2 | 91.49 | 91.48 | 94.38 | 91.48 |
| K = 4 | 94.38 | 95.23 | 95.38 | 94.38 | |
| K = 5 | 99.53 | 98.92 | 99.10 | 99.00 | |
| K = 7 | 98.43 | 97.12 | 96.22 | 96.33 | |
| CXR14 | K = 2 | 92.74 | 92.69 | 92.61 | 92.65 |
| K = 4 | 94.12 | 94.06 | 94.01 | 94.03 | |
| K = 5 | 95.18 | 95.13 | 95.17 | 95.15 | |
| K = 7 | 93.41 | 93.36 | 93.29 | 93.32 | |
| CheXpert | K = 2 | 90.22 | 90.25 | 90.17 | 90.21 |
| K = 4 | 91.84 | 91.81 | 91.77 | 91.79 | |
| K = 5 | 93.38 | 93.39 | 93.37 | 93.38 | |
| K = 7 | 91.07 | 91.03 | 90.98 | 91.00 |
Table VIII provides the performance estimation of the computational complexity of the proposed approach. It compares the training time, inference time, and model size of the proposed method against baseline models such as InceptionV3, CNN, and VGG-19. The proposed RAE-NetB7 exhibits the lowest inference time of 10.5 ms and shortest training time of 33.56 s and larger model size of 630 MB. Moreover, statistical validation through the P-test, T-test, and analysis of variance (ANOVA) shows minimum p-values (all ≤ 0.021), illustrating a crucial effectiveness variation of the proposed approach. To effectively perform the proposed method’s performance, a set of statistical hypothesis tests is employed on key performance metrics: the null hypothesis assumed that there is no crucial effectiveness variation among proposed method and existing methods, while the alternative hypothesis postulated that the proposed method performs well. Lower p-values (all ≤ 0.021) for the P-test and T-test demonstrate better performance. This emphasizes its computational efficiency and practical appropriateness for real-time diagnostic systems.
Table VIII. Analysis of the computational complexity and statistical results
| Dataset | Methods | Training time (s) | Inference time (ms) | Model size (MB) | P-test |
|---|---|---|---|---|---|
| COVID-19 | InceptionV3 | 41.56 | 19.44 | 580 | 0.021 |
| CNN | 39.43 | 15.48 | 590 | 0.019 | |
| VGG-19 | 36.54 | 13.43 | 600 | 0.017 | |
| RAE-NetB7 | 33.56 | 10.5 | 630 | 0.015 | |
| CXR14 | InceptionV3 | 45.15 | 23.34 | 702 | 0.028 |
| CNN | 68.26 | 19.50 | 698 | 0.035 | |
| VGG-19 | 48.32 | 21.44 | 700 | 0.018 | |
| RAE-NetB7 | 30.52 | 12.51 | 588 | 0.013 | |
| CheXpert | InceptionV3 | 56.27 | 25.67 | 789 | 0.029 |
| CNN | 70.29 | 24.52 | 852 | 0.022 | |
| VGG-19 | 49.60 | 19.27 | 782 | 0.021 | |
| RAE-NetB7 | 31.15 | 11.58 | 685 | 0.012 |
Table IX demonstrates the ablation study of the proposed method. This table presents the ablation study to demonstrate the contribution of every constituent in the proposed approach. Using only EfficientNetB7, the model achieves 94.80% accuracy. Adding standard regularization improves the performance slightly to 96.24%. However, with enhanced regularization, the model achieves a substantial boost in all metrics, reaching 99.53% accuracy and a 99.00% F1-score. This clearly shows the impact of the adaptive regularization mechanism, which dynamically tunes regularization strength during training, leading to more effective learning and better generalization.
Table IX. Ablation study of the proposed method
| Dataset | Methods | Accuracy (%) | Precision (%) | Recall (%) | F-score (%) |
|---|---|---|---|---|---|
| COVID-19 | EfficientNetB7 | 94.80 | 84.97 | 92.84 | 88.73 |
| L1 Regularization | 96.10 | 96.10 | 96.10 | 96.10 | |
| L2 Regularization | 97.40 | 97.40 | 97.40 | 97.40 | |
| Adaptive Regularization | 96.24 | 93.26 | 87.92 | 90.51 | |
| RAE-NetB7 | 99.53 | 98.92 | 99.10 | 99.00 | |
| CXR14 | EfficientNetB7 | 93.12 | 93.04 | 92.98 | 93.01 |
| L1 Regularization | 91.25 | 91.25 | 91.25 | 91.25 | |
| L2 Regularization | 92.70 | 92.70 | 92.70 | 92.70 | |
| Adaptive Regularization | 93.48 | 94.39 | 92.48 | 94.38 | |
| RAE-NetB7 | 95.18 | 95.13 | 95.17 | 95.15 | |
| CheXpert | EfficientNetB7 | 90.88 | 90.92 | 90.73 | 90.82 |
| L1 Regularization | 92.34 | 92.29 | 92.18 | 92.23 | |
| L2 Regularization | 89.40 | 89.40 | 89.40 | 89.40 | |
| Adaptive Regularization | 90.85 | 90.85 | 90.85 | 90.85 | |
| RAE-NetB7 | 93.38 | 93.39 | 93.37 | 93.38 |
1).ACCURACY FUNCTION
Figure 4 illustrates the training and validation accuracy for the RAE-NetB7. The model achieves a peak validation accuracy on the 10th epoch. At the 0th epoch, the training and validation accuracies are 0.957 and 0.980, respectively. By the 9th epoch, the training and validation accuracy have increased to 0.996, while the validation accuracy reaches 0.988.
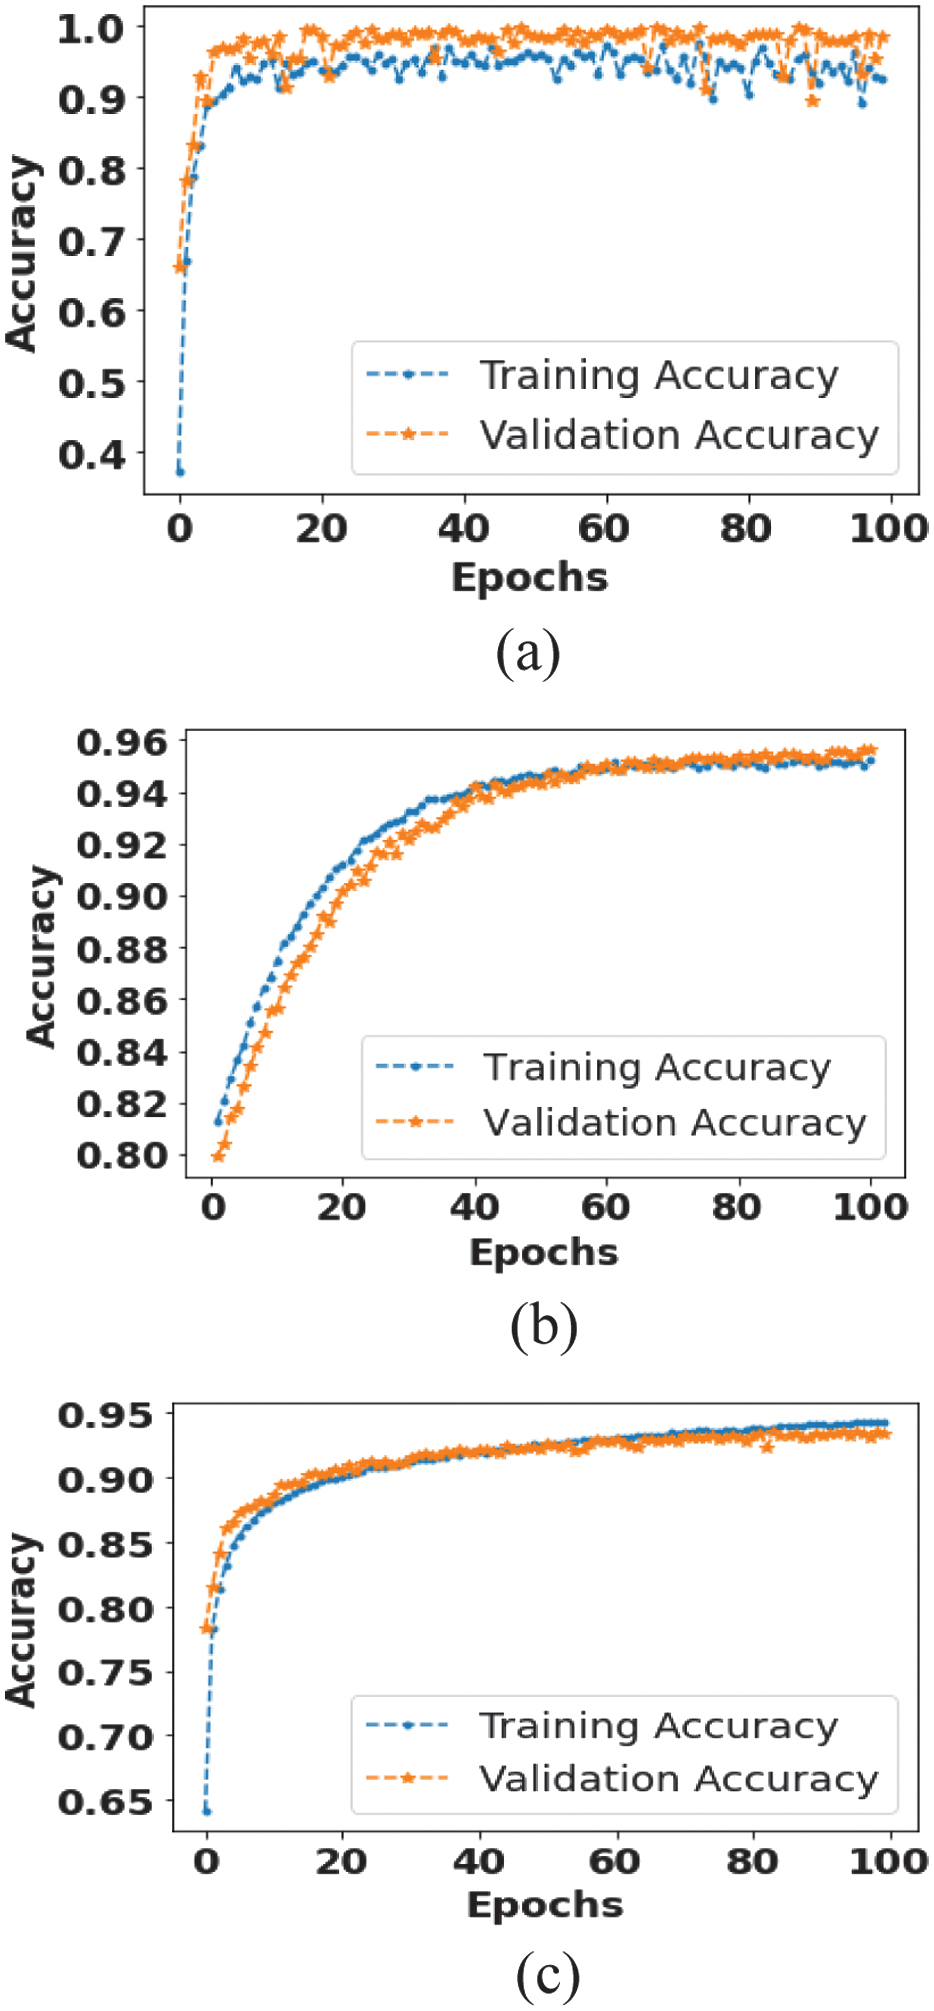 Fig. 4. Accuracy function for RAE-NetB7: (a) COVID-19 dataset, (b) CXR14 dataset, and (c) CheXpert dataset.
2).LOSS FUNCTION
Figure 5 signifies the loss function for the proposed RAE-NetB7. The validation loss reaches its minimum at the 8th epoch, indicating optimal model performance on unseen data at that point. While the training loss continues to decline until the 9th epoch, there is no significant improvement in validation loss beyond the 8th epoch, suggesting that further training resulted in overfitting.
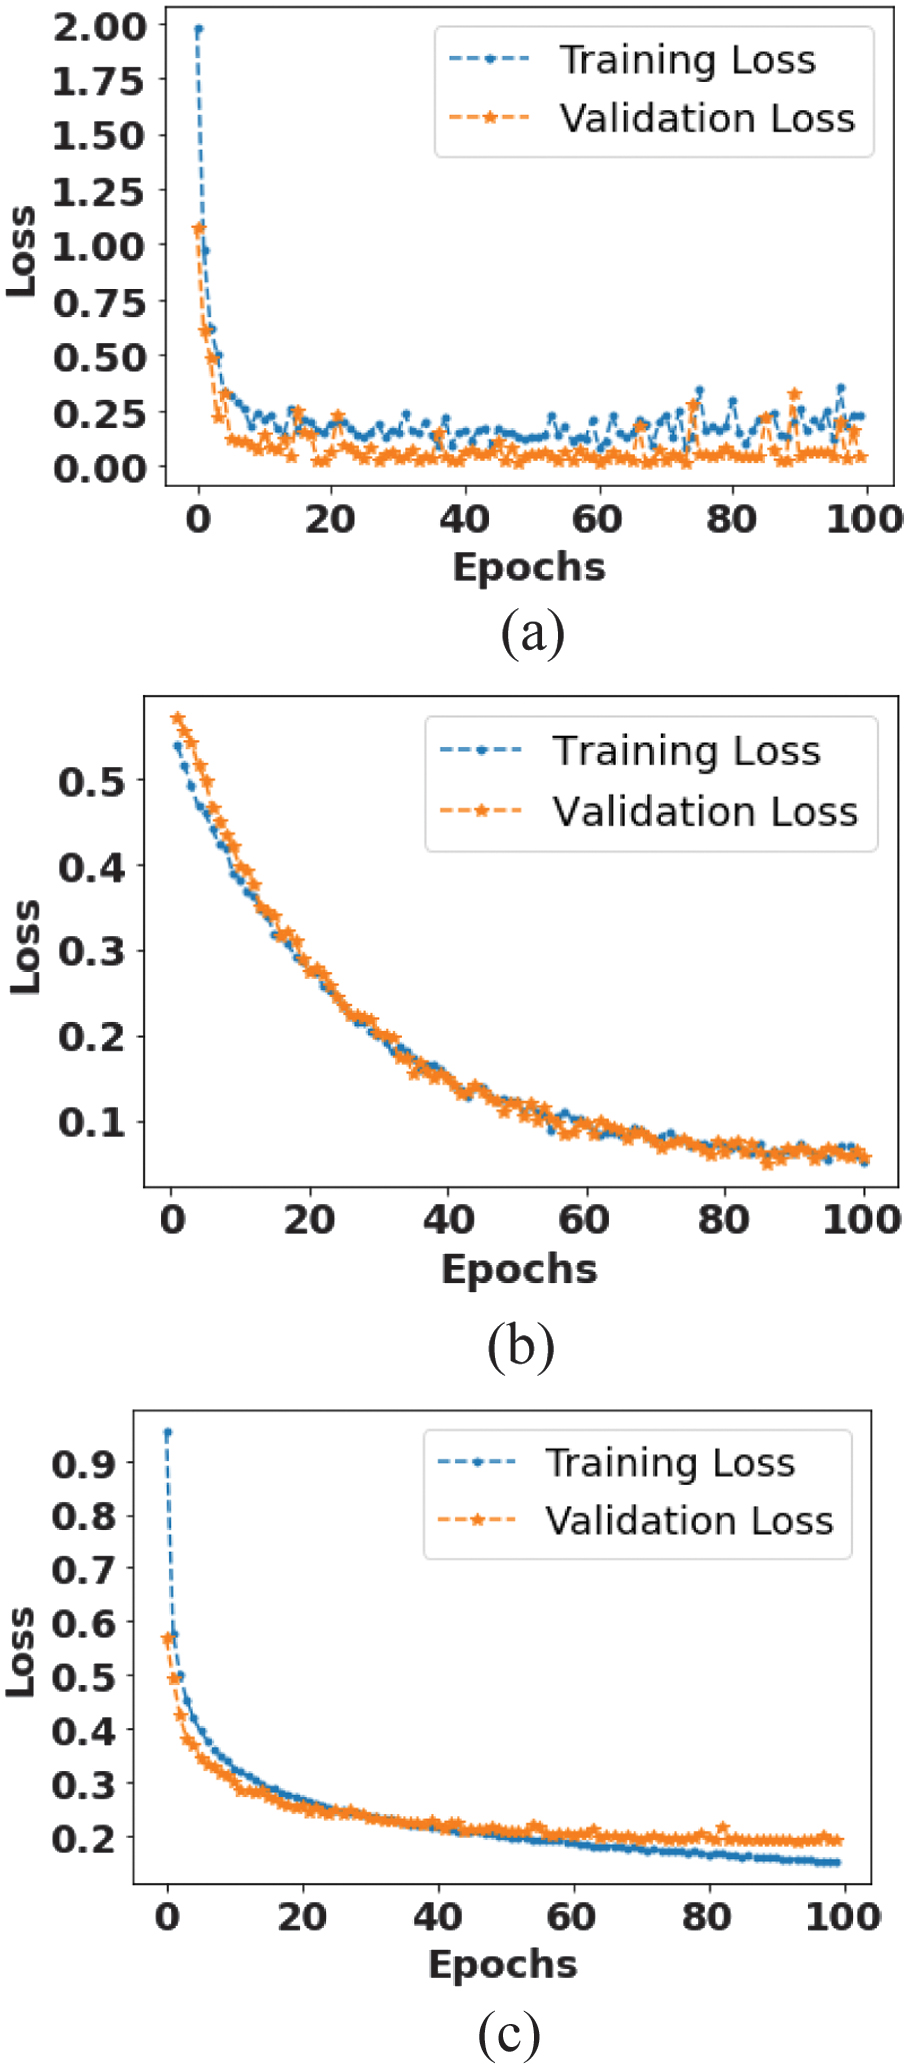 Fig. 5. Loss function for RAE-NetB7: (a) COVID-19 dataset, (b) CXR14 dataset, and (C) CheXpert dataset.
3).CONFUSION MATRIX
Figure 6 illustrates the confusion matrix of the proposed method using different datasets. The confusion matrix is obtained on the test set (20% split) of the COVID-19 radiography dataset. The matrix demonstrates that the proposed RAE-NetB7 accurately classifies the majority of samples across all four classes, confirming balanced predictive performance without class bias. The confusion matrix is validated using the true and predicted class labels. Based on the confusion matrix, the RAE-NetB7 correctly classifies 1,730 images as COVID-19, 2,983 as lung opacity, 38 as normal, and 657 as viral pneumonia classes.
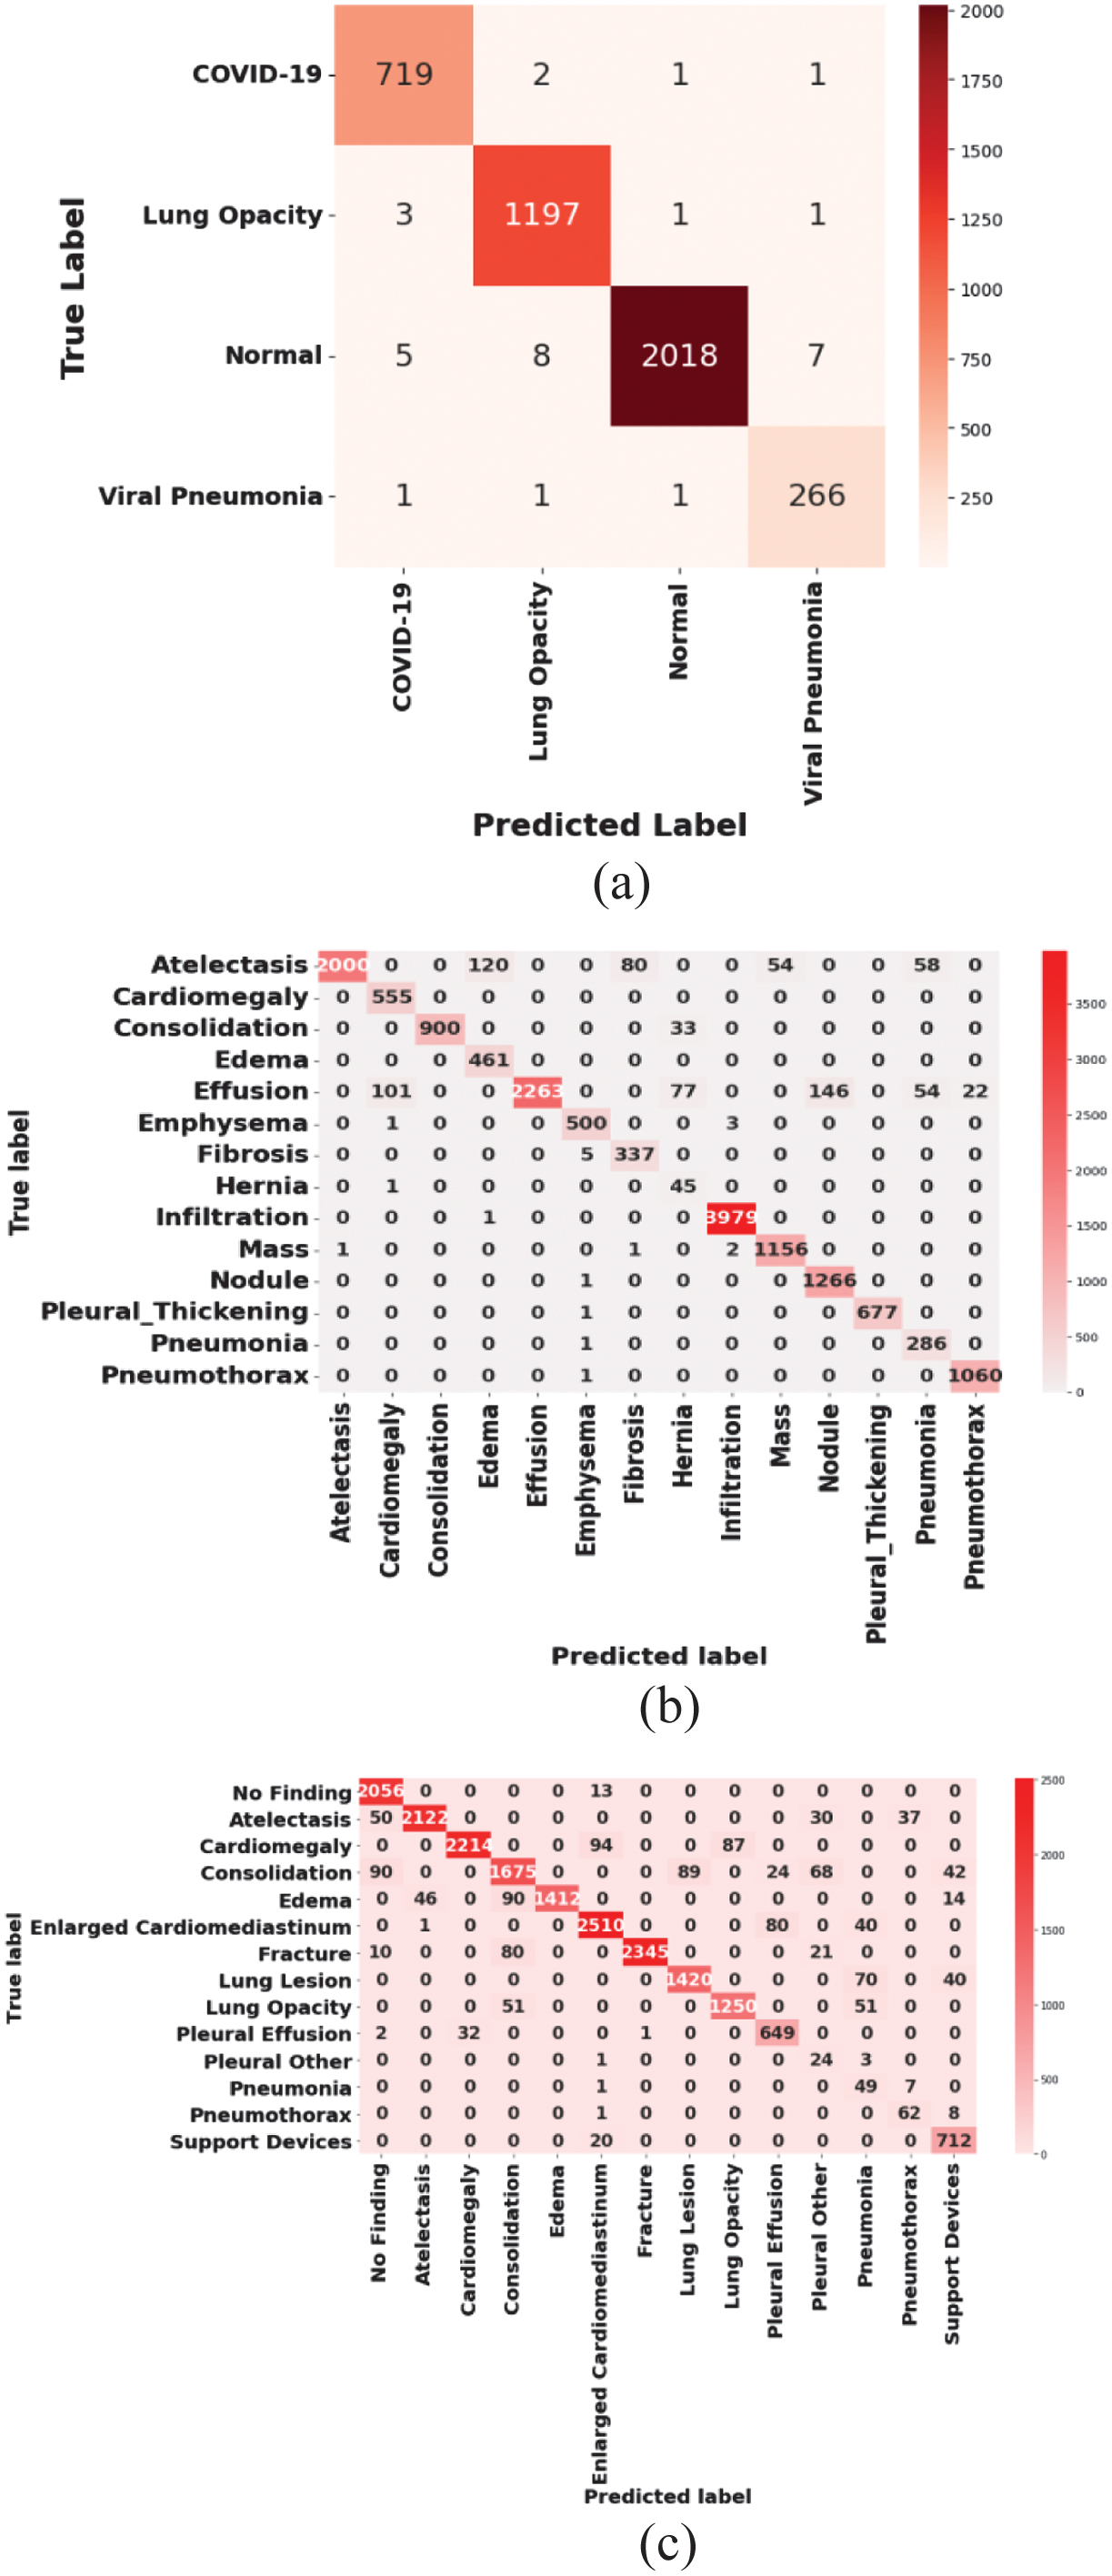 Fig. 6. Confusion matrix for RAE-NetB7: (a) COVID-19 dataset, (b) CXR14 dataset, and (c) CheXpert dataset.
B.COMPARATIVE ANALYSIS
Here, the performance of the proposed RAE-NetB7 approach is compared with the existing approaches. The existing methods considered for comparison include CovidDWNet+GB [16], fine-tuned ResNet50 [17], CBIR [18], and DCNN-CoV-RadNet [19]. Furthermore, the effectiveness of the proposed method is evaluated. EfficientNetB7 supports end-to-end training, simplifying its integration into automated pipelines for COVID-19 detection and contributing to improved accuracy results. Table X displays the comparison results on the CXR dataset.
Table X. Comparison results using different datasets
| Dataset | Methods | Accuracy (%) | Precision (%) | Recall (%) |
|---|---|---|---|---|
| COVID-19 | CovidDWNet+GB [ | 96.81 | NA | NA |
| Fine-tuned ResNet50 [ | 99.17 | NA | NA | |
| CBIR [ | NA | 99.00 | NA | |
| DCNN-CoV-RadNet [ | 97 | NA | 99.8 | |
| Proposed RAE-NetB7 | 99.53 | 99.10 | 99.00 | |
| CXR-14 | MLRFNet [ | 79.3 | NA | 76.2 |
| CXray-EffDet [ | 94.53 | 90 | 92.36 | |
| Proposed RAE-NetB7 | 95.18 | 95.13 | 95.17 | |
| CheXpert | Augmentation with Visual Transformer [ | 89.1 | 90.2 | 92.5 |
| Proposed RAE-NetB7 | 93.38 | 93.39 | 93.37 |
C.DISCUSSION
This portion discusses the accomplishments of the proposed approach, alongside the limitations of the existing approaches. The limitations of the existing studies are noted as follows: CovidDWNet+GB [16] performs poorly compared to other methods because it is constrained in its ability to capture complex patterns and hierarchical features in the data. In fine-tuned ResNet50 [17], important features are not extracted, leading to an increased number of false negatives and false positives. In CBIR [18], feature selection is not performed, resulting in poor performance. In DCNN-CoV-RadNet [19], feature selection is critical to capture underlying patterns in the data. In Cov-Net [20], the redundant data is not systematically addressed in either the feature learning or fusion modules, resulting in lower accuracy. To solve these issues, this research proposes the EfficientNetB7 technique for COVID-19 classification. EfficientNetB7 supports end-to-end training, making it easier to integrate into an automated pipeline for COVID-19 detection, allowing for faster training times and enhanced accuracy, especially when annotated medical data is limited. By performing feature extraction with NASNet and feature selection with DPE-ACO, the classification with EfficientNetB7 ensures that the model is trained on the most relevant features. The proposed RAE-NetB7 approach enhances CXR disease classification by preventing overfitting and optimizing feature extraction. Its robust performance ensures accurate and reliable diagnoses across diverse disease conditions. The findings demonstrate that the RAE-NetB7 method improves disease classification through CXR samples by addressing overfitting and enhancing generalization. EfficientNetB7, with its compound scaling, significantly extracts hierarchical features, while regularization dynamically adjusts weight penalties to enhance model effectiveness. This integration ensures robust classification across different disease conditions, making it highly relevant for accurate and reliable CXR-based diagnoses.
The dataset size is sufficiently large (over 21,000 CXR images across four classes), which reduces the likelihood of performance being inflated through small-sample bias. The proposed method combines an adaptive softmax-based regularization, where each parameter is assigned a learnable regularization factor that dynamically adjusts during training. Unlike fixed L1/L2 penalties, this eliminates both under- and over-regularization, thereby improving generalization. This is evidenced in the ablation study (Table IX), where accuracy improves from 94.80% (EfficientNetB7 baseline) to 99.53% with adaptive regularization, demonstrating that the performance gain stems from the novel mechanism rather than dataset memorization. Robustness is validated through k-fold cross-validation (Table VII), where consistent performance over various folds demonstrates that the model is not overfitting to an individual train-test split. Moreover, statistical tests (P-test in Table VIII) confirm that the observed improvements are significant (p ≤ 0.021).
VI.CONCLUSION
Globally, the COVID-19 pandemic caused numerous deaths, and various research studies focused on different transmission methods and treatments for this disease. This research proposed the RAE-NetB7 technique for the classification of COVID-19. The proposed EfficientNetB7 helped to prevent overfitting by penalizing large weights in the network and dynamically adjusting the regularization strength based on feature significance. The DPE-ACO approach was used for feature selection, balancing exploration and exploitation by adjusting pheromone levels based on the success of previous iterations. The experimental findings demonstrated that the proposed approach achieved a commendable accuracy of 99.53% and a precision of 98.92%, which outperformed existing methods such as CovidDWNet+GB and fine-tuned ResNet50. Future work will build upon these findings by exploring additional DL approaches for COVID-19 classification to further improve performance. Key experiments will include testing different architectures, optimizing hyperparameters, and validating models on larger datasets for enhanced generalization.
A.NOTATION LIST
| Notations | Descriptions |
|---|---|
| Probability | |
| An array that involves vectors, matrices, or tensors | |
| Constant coefficient | |
| and | Actual and updated objective functions |
| Weighted sum of categorical cross-entropy and the triplet loss function | |
| Square of the L2 norm of | |
| Regularization asset | |
| Predetermined constant | |
| Input vector | |
| Number of classes | |
| Output vector | |
| Trainable scalar variable | |
| Regularized loss function | |
| Actual loss function | |
| Number of parameters | |
| Constant | |
| Function applied to the parameter |