I.INTRODUCTION
The primary objective of athletics training in a physical education context is to systematically enhance performance while minimizing the risk of injury and burnout [1]. A cornerstone of this process is the precise monitoring and management of training intensity and load. Training intensity refers to the physiological and biomechanical stress of a single session, while training load encompasses the cumulative stress over time [2]. In track and field, a discipline is characterized by diverse and high-intensity activities, accurately gauging this stress is paramount. This discipline comprises a wide range of sub-events, from explosive sprints, jumps, and throws to endurance-based middle and long-distance runs. Each of these imposes distinct biomechanical and physiological demands, suggesting that an ideal monitoring system should capture event-specific intensity patterns rather than applying a one-size-fits-all metric. Traditional methods of intensity monitoring, such as coach’s perceptual analysis, session Rating of Perceived Exertion (sRPE), and periodic laboratory tests (e.g., VO2 max, blood lactate profiling), are often subjective, intermittent, and detached from the actual training environment [3]. This lack of granular, real-time data can lead to suboptimal training prescriptions, increased injury risk, and hindered athletic development for students [4].
The advent of the Internet of Things (IoT) and wireless sensor network (WSN) technologies presents a transformative opportunity for sports science [5]. Miniaturized, low-power, and high-fidelity sensors can now be unobtrusively integrated into an athlete’s attire or equipment, enabling the continuous collection of biomechanical and physiological data during natural training activities [6]. This data, when transmitted wirelessly and processed with intelligent algorithms, can provide an unprecedented, objective view of training intensity.
This paper addresses the critical need for an integrated, technology-driven solution in educational sports settings. We propose the design and empirical validation of a comprehensive system for monitoring training intensity in track and field, built upon a robust WSN foundation. The system’s novelty lies in its holistic approach, combining multi-modal sensing (inertial and cardiac), a reliable long-range communication protocol suitable for large outdoor tracks, and a software platform that translates raw sensor data into actionable, coach-friendly metrics.
The primary research objectives are as follows:
- (1)To design a hardware architecture comprising wearable inertial measurement unit (IMU)/heart rate (HR) sensors and a LoRa (Long Range)-based data transmission network.
- (2)To develop a software system capable of real-time data ingestion, activity classification, and intensity metric calculation (PlayerLoad, TRIMP).
- (3)To validate the system’s accuracy and reliability against gold-standard laboratory measures.
- (4)To investigate the practical efficacy of the system through a longitudinal field study, assessing its impact on athlete performance and well-being.
The remainder of this paper is structured as follows: Section II reviews recent literature on WSN and sensor applications in sports. Section III details the hardware architecture and sensor design. Section IV describes the software system and data processing algorithms. Section V outlines the experimental methodology and data analysis procedures. Section VI presents and discusses the results, including performance data and chart analysis. Finally, Section VII concludes the work and suggests directions for future research.
II.LITERATURE REVIEW
The application of sensor technology in sports has evolved rapidly from simple pedometers and HR monitors to sophisticated, multi-sensor platforms. This review focuses on recent advancements in WSNs, inertial sensors, and their specific applications in athletics training and load monitoring.
A.WSNS IN SPORTS
WSNs, a core component of the IoT paradigm, are networks of spatially distributed autonomous devices that use sensors to monitor physical or environmental conditions [7]. In sports, their primary advantage is the ability to capture data in ecologically valid settings—the track, field, or court—free from the constraints of wired systems [8]. Early systems often relied on Bluetooth or Wi-Fi, but these protocols have limitations in range and power consumption, making them less ideal for large outdoor areas like a 400-m track [9]. Recent studies have explored more suitable protocols. For instance, Lopez et al. (2021) successfully implemented a ZigBee-based network for monitoring rowing technique, highlighting its low-power consumption but acknowledging its limited range in open water [10]. In contrast, Low-Power Wide-Area Network (LPWAN) technologies like LoRa and NB-IoT have gained traction for their exceptional range and energy efficiency. While NB-IoT offers higher data rates and leverages cellular infrastructure, it incurs service costs. Sigfox provides ultra-narrowband communication but has very low data rates. LoRaWAN, operating in the unlicensed spectrum, strikes a favorable balance for sports applications: it offers long-range (several kilometers in open areas), very low power consumption, and sufficient bandwidth for transmitting IMU and HR data summaries, making it highly suitable for the scale and power constraints of a track and field facility. A seminal study by Gardašević et al. (2021) demonstrated the potential of LoRa for sport player monitoring, highlighting its robustness in outdoor environments [11]. This makes LoRa a particularly compelling choice for the scale of a track and field facility.
B.INERTIAL MEASUREMENT UNITS (IMUs) FOR BIOMECHANICAL ANALYSIS
IMUs, which typically combine accelerometers, gyroscopes, and magnetometers, have become the de facto standard for quantifying human movement [12]. Their application in track and field is extensive. In sprinting, IMUs placed on the lower back or shanks can accurately detect key events like foot-strike and toe-off, allowing for the calculation of stride length, stride frequency, and ground contact time [13,14]. Wouda et al. (2018) used IMUs to estimate vertical ground reaction forces during running, a key indicator of loading [15]. In jumping events, IMUs can measure jump height, flight time, and take-off velocity with high accuracy [16]. Beyond performance, IMU-derived metrics are crucial for load monitoring. The vector magnitude of accelerometer data, often summarized as PlayerLoad, is a widely accepted measure of external training load [17]. Barron et al. (2021) conducted a systematic review validating the use of IMUs for measuring training load in team sports, confirming their reliability when compared to criterion measures [18].
C.INTEGRATED SYSTEMS FOR TRAINING LOAD MONITORING
The current trend is toward multi-modal systems that fuse data from various sensors to provide a more holistic picture of athlete strain [19]. The combination of IMU data (external load) and HR data (internal load) is particularly powerful. The Training Impulse (TRIMP), which integrates exercise duration and HR zones, is a well-established internal load metric [20]. Modern systems can compute this in real time. For example, Niemi et al. (2022) developed a system using wearable sensors to monitor endurance training load, combining HR and accelerometry data to provide a comprehensive overview of athlete strain [21].
Machine learning (ML) further enhances these systems by enabling automatic activity recognition and more sophisticated intensity modeling. Chong et al. (2022) used a deep learning model to classify different swimming strokes from a single IMU with high accuracy, demonstrating the power of ML for complex activity recognition in sports [22]. This allows for the automatic segmentation of a complex training session into its constituent parts, enabling drill-specific intensity analysis.
D.RESEARCH GAP AND CONTRIBUTION
While the aforementioned studies demonstrate the viability of individual components, there is an identified gap in the literature for a fully integrated, end-to-end system designed specifically for the heterogeneous environment of track and field instruction within an educational institution. Many existing solutions are either commercial “black boxes” or research prototypes that lack robust, long-range communication and validation in a real-world educational setting. This study aims to fill this gap by:
- (1)Proposing a unified hardware/software architecture based on the robust LoRa protocol.
- (2)Developing a custom activity classification model tailored to common track and field drills.
- (3)Validating the system not only in a lab but also through a longitudinal educational intervention, measuring its impact on tangible student outcomes like performance and well-being.
III.SYSTEM ARCHITECTURE AND HARDWARE DESIGN
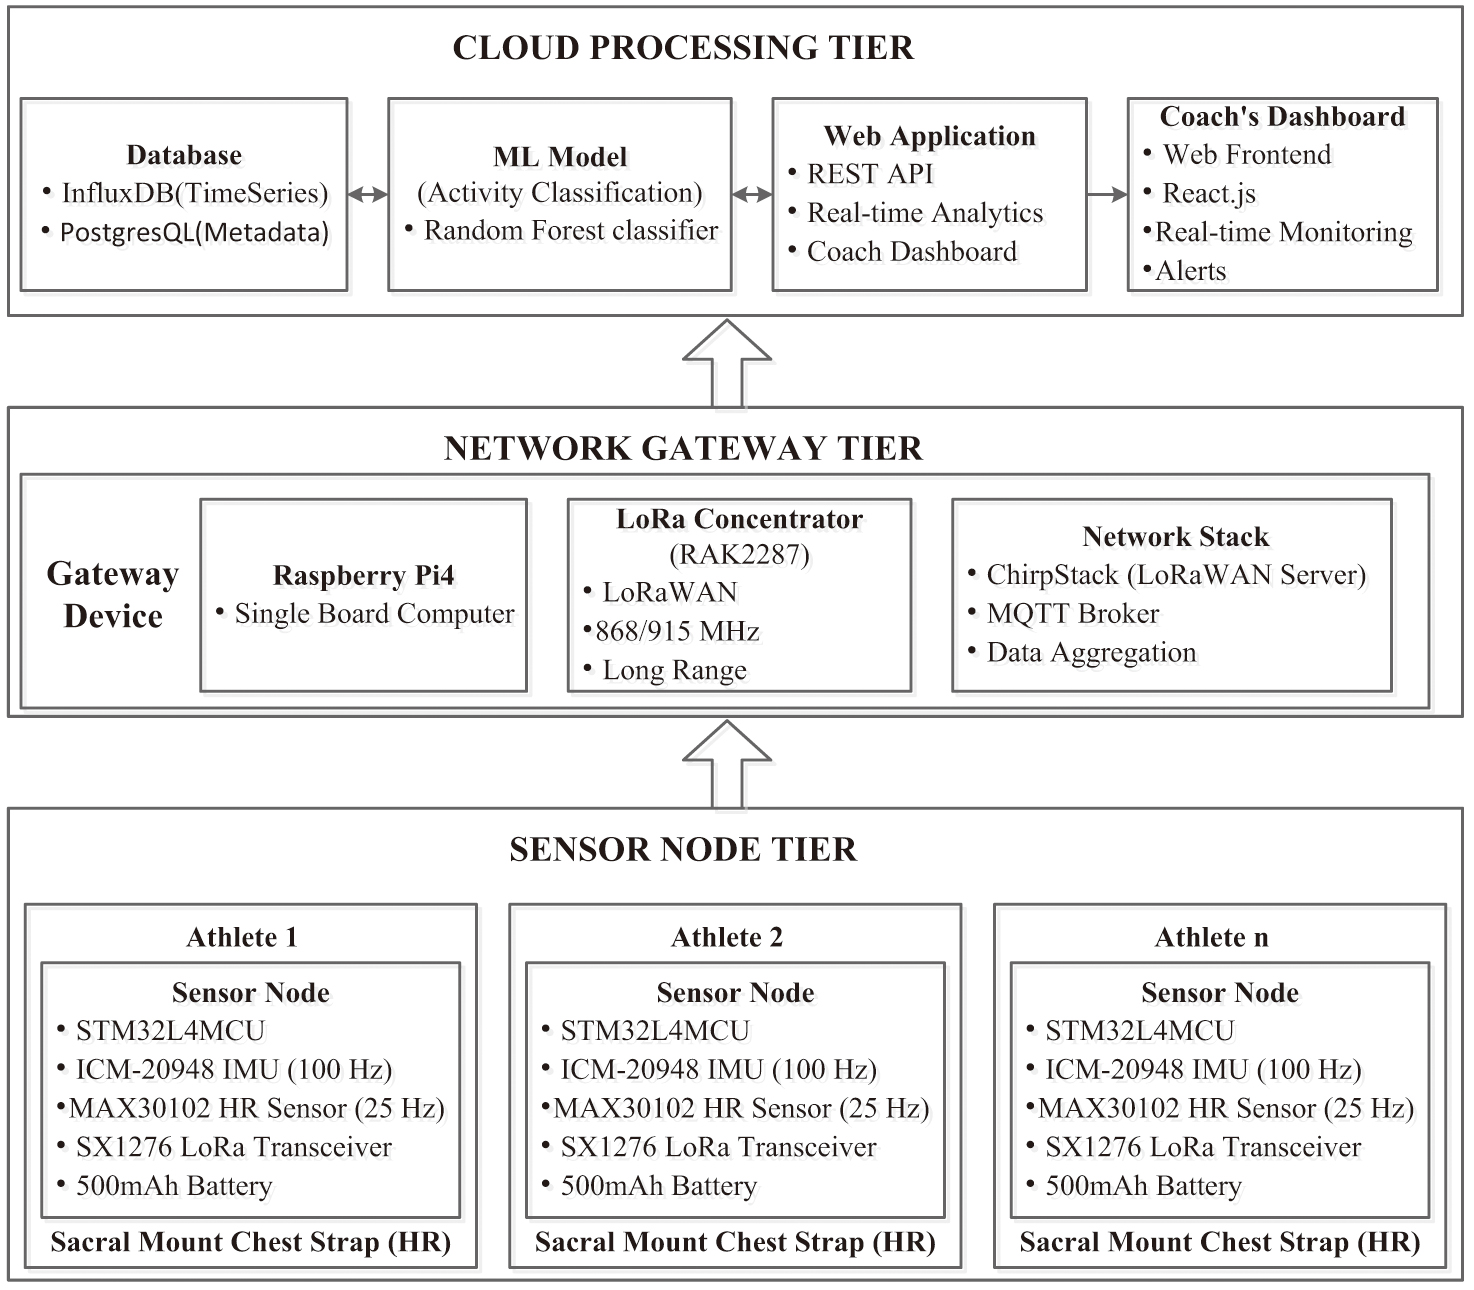
The proposed system is designed with a three-tier architecture: the Sensor Node Tier, the Network Gateway Tier, and the Cloud Processing Tier.
A.SYSTEM OVERVIEW
The overall system architecture is depicted in Fig. 1. Athletes wear custom sensor nodes that collect biomechanical and physiological data. This data is packetized and transmitted via the LoRaWAN protocol to a gateway located on the track. The gateway aggregates the data and forwards it to a cloud server via a 4G/LTE or Ethernet backhaul. The cloud server hosts the database and application logic, processes the data, and serves a web-based dashboard to coaches and physical education instructors.
B.SENSOR NODE DESIGN
Each sensor node is a self-contained unit designed for minimal obtrusiveness and maximum battery life. The core components are as follows:
- (1)Microcontroller: An ARM Cortex-M4 processor (STM32L4 series) was selected for its low-power characteristics and sufficient computational power for on-board sensor data preprocessing. The microcontroller manages power by entering deep sleep mode between transmission intervals, waking only for data sampling and packet sending.
- (2)IMU Sensor: A 9-DoF IMU (TDK ICM-20948) is used, which includes a 3-axis accelerometer (± 16g), a 3-axis gyroscope (± 2000 dps), and a 3-axis magnetometer. The sampling rate is configurable up to 200 Hz, with a default setting of 100 Hz for this study, providing a balance between detail and power consumption.
- (3)Heart Rate Sensor: A reflective photoplethysmography (PPG) sensor (Maxim Integrated MAX30102) is integrated to capture HR data. It is sampled at 25 Hz.
- (4)LoRa Transceiver: A Semtech SX1276 LoRa modem handles communication. It operates in the 868 MHz (EU)/915 MHz (US) ISM communication parameters were set as follows: Spreading Factor (SF) = 9, Bandwidth (BW) = 125 kHz, Coding Rate (CR) = 4/5. This configuration provides a robust link budget for the track environment while maintaining a reasonable data rate and airtime.
- (5)Power Supply: A 500-mAh Li-Po battery powers the node, estimated to provide over 8 hours of continuous operation.
The node is housed in a lightweight (25g), 3D-printed casing with a silicone skin-contact strap.
The sensor node is typically worn on the mid-back (sacrum) using an elastic belt, a location shown to effectively capture whole-body movement [23]. The PPG sensor is embedded in a separate chest strap for optimal signal quality.
C.DATA ACQUISITION AND PREPROCESSING
On the microcontroller, raw sensor data from the IMU and PPG is processed through a pipeline:
- (1)Calibration: The IMU undergoes a static calibration on startup to nullify offsets.
- (2)Filtering: Raw accelerometer and gyroscope data are passed through a fourth-order low-pass Butterworth filter with a 20-Hz cutoff frequency to remove high-frequency noise [14]. The magnetometer data is filtered to reduce hard and soft iron distortions.
- (3)Sensor Fusion: A complementary filter is implemented to fuse accelerometer and gyroscope data to obtain a stable orientation (roll, pitch) estimate. For more advanced analysis, a quaternion-based Kalman filter runs on the cloud server.
- (4)Feature Extraction: Simple features like signal magnitude area (SMA) and root mean square (RMS) are calculated on the microcontroller for each 1-second epoch to enable low-power transmission of summary data. Raw data can also be streamed for post hoc analysis.
- (5)Packetization: Processed data (or raw data, depending on mode) is packaged with a timestamp and unique node ID and sent via LoRa. The transmission interval is set to 2 seconds to conserve battery while providing near-real-time verification of hardware stability, and nodes were tested under controlled lab conditions simulating various exercise intensities (from walking to maximal sprinting). No data packet corruption or node failure was observed, confirming stable operation across the intended intensity spectrum.
D.GATEWAY DESIGN
The gateway is built on a Raspberry Pi 4 single-board computer equipped with a LoRa concentrator board (RAK2287). The gateway runs a LoRaWAN network server (ChirpStack) which manages the network, receives packets from all sensor nodes, and forwards them via a secure MQTT protocol to the cloud application. Its strategic placement at the center of the athletic field ensures full coverage, a practice recommended for robust LPWAN deployment [24].
IV.SOFTWARE SYSTEM DESIGN
The software system is a cloud-native application built using microservices architecture, as shown in Fig. 2.
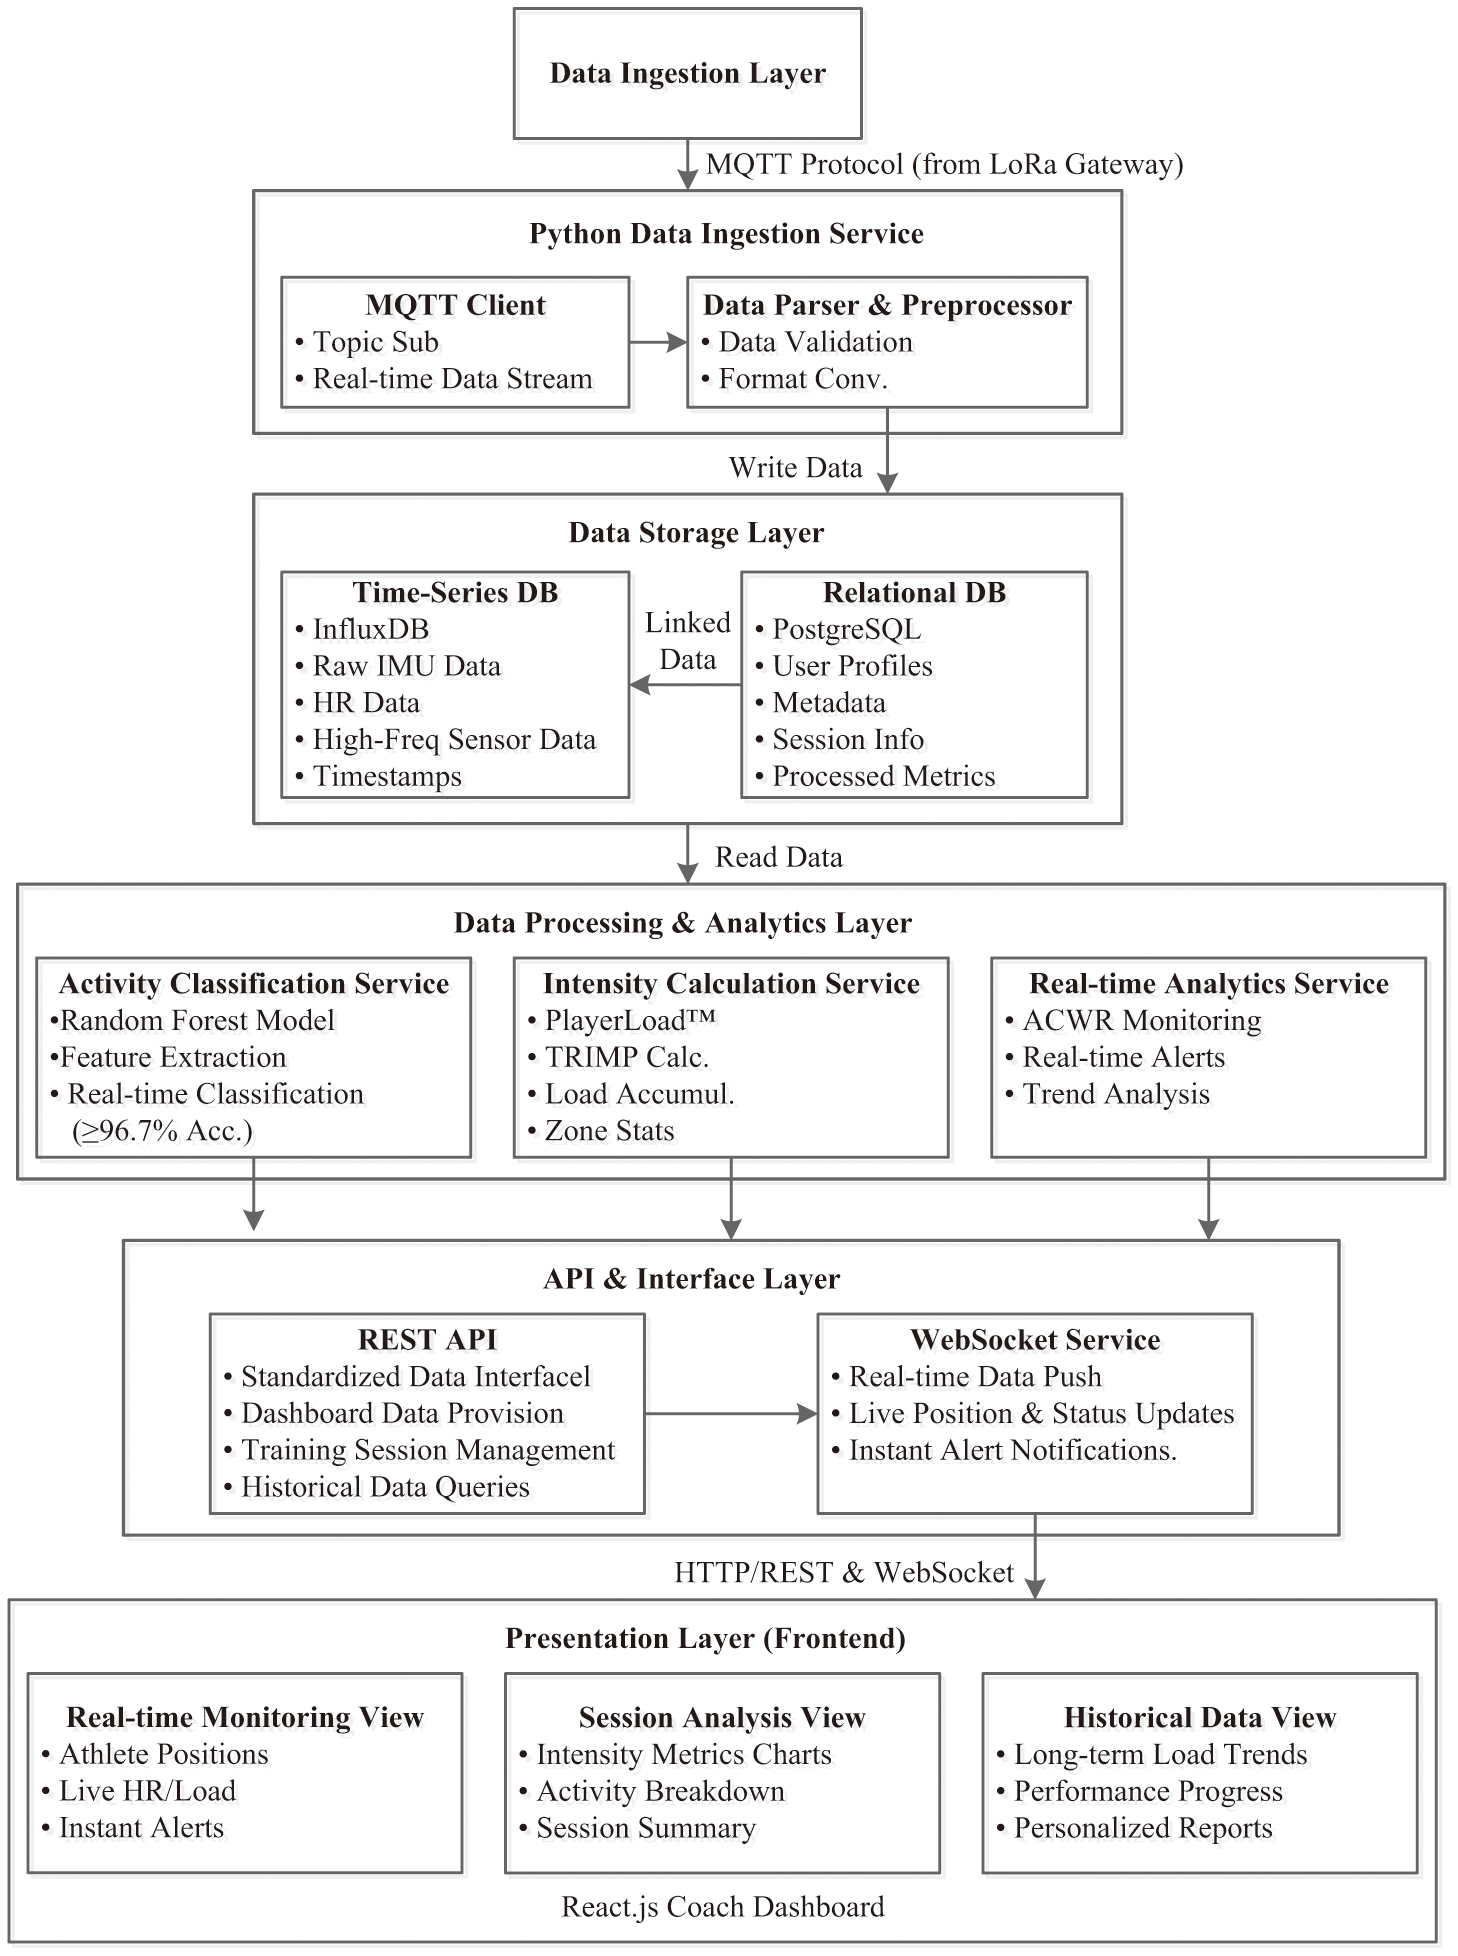 Fig. 2. Software system architecture.
A.DATA INGESTION AND STORAGE
An MQTT broker (Mosquitto) receives data streams from the gateway. A custom Python service subscribes to the MQTT topics and writes the high-frequency time-series data (accelerometer, gyroscope) into an InfluxDB database, optimized for temporal data. Slower-changing data (computed metrics, HR) is stored in a PostgreSQL database for relational integrity.
B.ACTIVITY CLASSIFICATION MODULE
A key component is the ML model that classifies the athlete’s activity in real time. We collected a labeled dataset of 15 common track and field drills (e.g., steady-state run, sprint, recovery jog, bounding, high knees) from 10 athletes, resulting in 25 hours of IMU dataset that was balanced across activities, with each class containing approximately 1.5–2 hours of data. The distribution was verified to prevent model bias toward more frequent activities. From the raw 100 Hz data, we extracted 126 features in the time and frequency domains over 3-second sliding windows (50% overlap) [25]. Features that included mean, standard deviation, energy, entropy, and correlation between recursive feature elimination (RFE) process was used to select the top 30 most predictive features, reducing computational complexity.
A Random Forest classifier was trained on this dataset, a method proven effective for human activity recognition [26]. The hyperparameters of the Random Forest (number of trees, maximum depth, etc.) were optimized via a grid search with 5-fold cross-validation on the training set. For comparison, a convolutional neural network (CNN) was also trained on the raw signal windows. The Random Forest achieved comparable accuracy (96.7%) to the CNN (97.1%) but with significantly lower computational cost and latency, making it more suitable for real-time deployment on our cloud 10-fold cross-validation, the model achieved an overall accuracy of 96.7%. Furthermore, the model was evaluated on a completely independent test set (20% of the total data, held out from the training/validation process), achieving an accuracy of 95.8%, confirming its generalization capability. The model is deployed as a Python service that consumes the live IMU data stream, performs the same feature extraction, and predicts the activity class every 1.5 seconds. This allows the system to automatically log the drill type and duration for each athlete.
C.INTENSITY METRIC CALCULATION
- (1)PlayerLoad (PL): Calculated from the sacral-mounted IMU as the square root of the sum of the squared instantaneous rates of change in acceleration in three planes (x, y, z), divided by 100 [17]. It is expressed as PL per minute:
- (2)Training Impulse (TRIMP): Calculated using the Edwards’ method, which sums the product of time spent in each HR zone and a multiplier for that zone [20]. The zones are defined as percentages of the athlete’s maximum heart rate (HRmax):
These metrics are calculated for every epoch of the training session and aggregated to provide session-level and weekly load totals. The fusion of internal and external load provides a more complete picture, as emphasized in recent reviews [27].
D.COACH’S DASHBOARD
A responsive web application built with React.js serves as the user interface for coaches. The dashboard displays: (1) real-time location and status of all athletes, (2) live streams of key metrics (current HR, instantaneous PlayerLoad, current activity), (3) session summaries with drill breakdowns and total PL/TRIMP, (4) longitudinal dashboards showing acute:chronic workload ratio (ACWR) to monitor injury risk [28], and (5) alerts for excessive intensity or potential overtraining, facilitating immediate intervention as suggested by studies on load management [29].
V.EXPERIMENTAL SETUP AND DATA ANALYSIS
A mixed-methods approach was employed, involving both laboratory validation and a longitudinal field study.
A.PARTICIPANTS
Forty-five university student-athletes (25 male, 20 female; age: 20.4 ± 1.8 years; BMI: 21.5 ± 1.9 kg/m2) from the track and field team voluntarily participated. They were randomly assigned to an Experimental Group (EG, n = 23) and a Control Group (CG, n = 22). All participants provided informed consent. The study was approved by the University’s Institutional Review Board.
B.LABORATORY VALIDATION PROTOCOL
A sub-sample of 15 athletes performed a standardized treadmill running protocol with increasing speed (from 8 km/h to 18 km/h, increments of 2 km/h every 3 minutes). During the test, the athletes wore the sensor node, and capillary blood samples were taken at the end of each stage to measure blood lactate concentration [La−] (Gold Standard: YSI 2300 Stat Plus Analyzer). The system-calculated PlayerLoad for each stage was correlated with the corresponding [La−]. HR from the sensor node was validated against a Polar H10 chest strap (considered a criterion device) [30]. The sensor nodes remained securely attached and functional throughout all stages of the protocol, from low-intensity running to maximal exertion, confirming physical stability.
C.LONGITUDINAL FIELD STUDY
The main intervention lasted 12 weeks during the competitive preseason. Both groups followed the same periodized training plan, designed and supervised by the same head coaching team, to ensure consistency in the overall training philosophy and session key difference was in monitoring:
- (1)Control Group (CG): Training was prescribed and adjusted based on traditional methods: coach’s observation, pre- and post-session sRPE, and weekly performance tests (e.g., time trials).
- (2)Experimental Group (EG): The coach prescribed and adjusted training based primarily on the data from the proposed system. The dashboard provided daily reports on each athlete’s session load, ACWR, and recovery status. Training volume or intensity was modified if an athlete’s ACWR exceeded 1.5 (indicating high injury risk) [28] or was below 0.8 (indicating potential undertraining).
D.DATA COLLECTION AND STATISTICAL ANALYSIS
- (1)System Data: PlayerLoad, TRIMP, activity classification logs for every session.
- (2)Performance Data: Personal best times in the athletes’ primary events, recorded at the start and end of the study.
- (3)Well-being Data: Daily subjective wellness questionnaires (sleep quality, muscle soreness, fatigue, stress) using a 1–5 Likert scale [31].
Statistical analysis was performed using SPSS v28. Pearson’s correlation coefficient was used for validation. Independent t-tests and analysis of covariance (ANCOVA), with baseline performance as a covariate, were used to compare performance improvements between EG and CG. A significance level of p < 0.05 was set.
VI.RESULTS AND DISCUSSION
A.SYSTEM VALIDATION RESULTS
The laboratory validation confirmed the high accuracy of the system. The correlation between the system’s PlayerLoad and blood lactate concentration was r = 0.92 (p < 0.001), indicating a strong positive relationship (Fig. 3). This result aligned with findings that IMU-derived metrics were valid indicators of physiological stress [32]. The HR data from the custom sensor node showed an almost perfect agreement with the Polar H10, with a mean absolute error of 1.2 ± 0.8 bpm, which is considered excellent for a research-grade device [33].
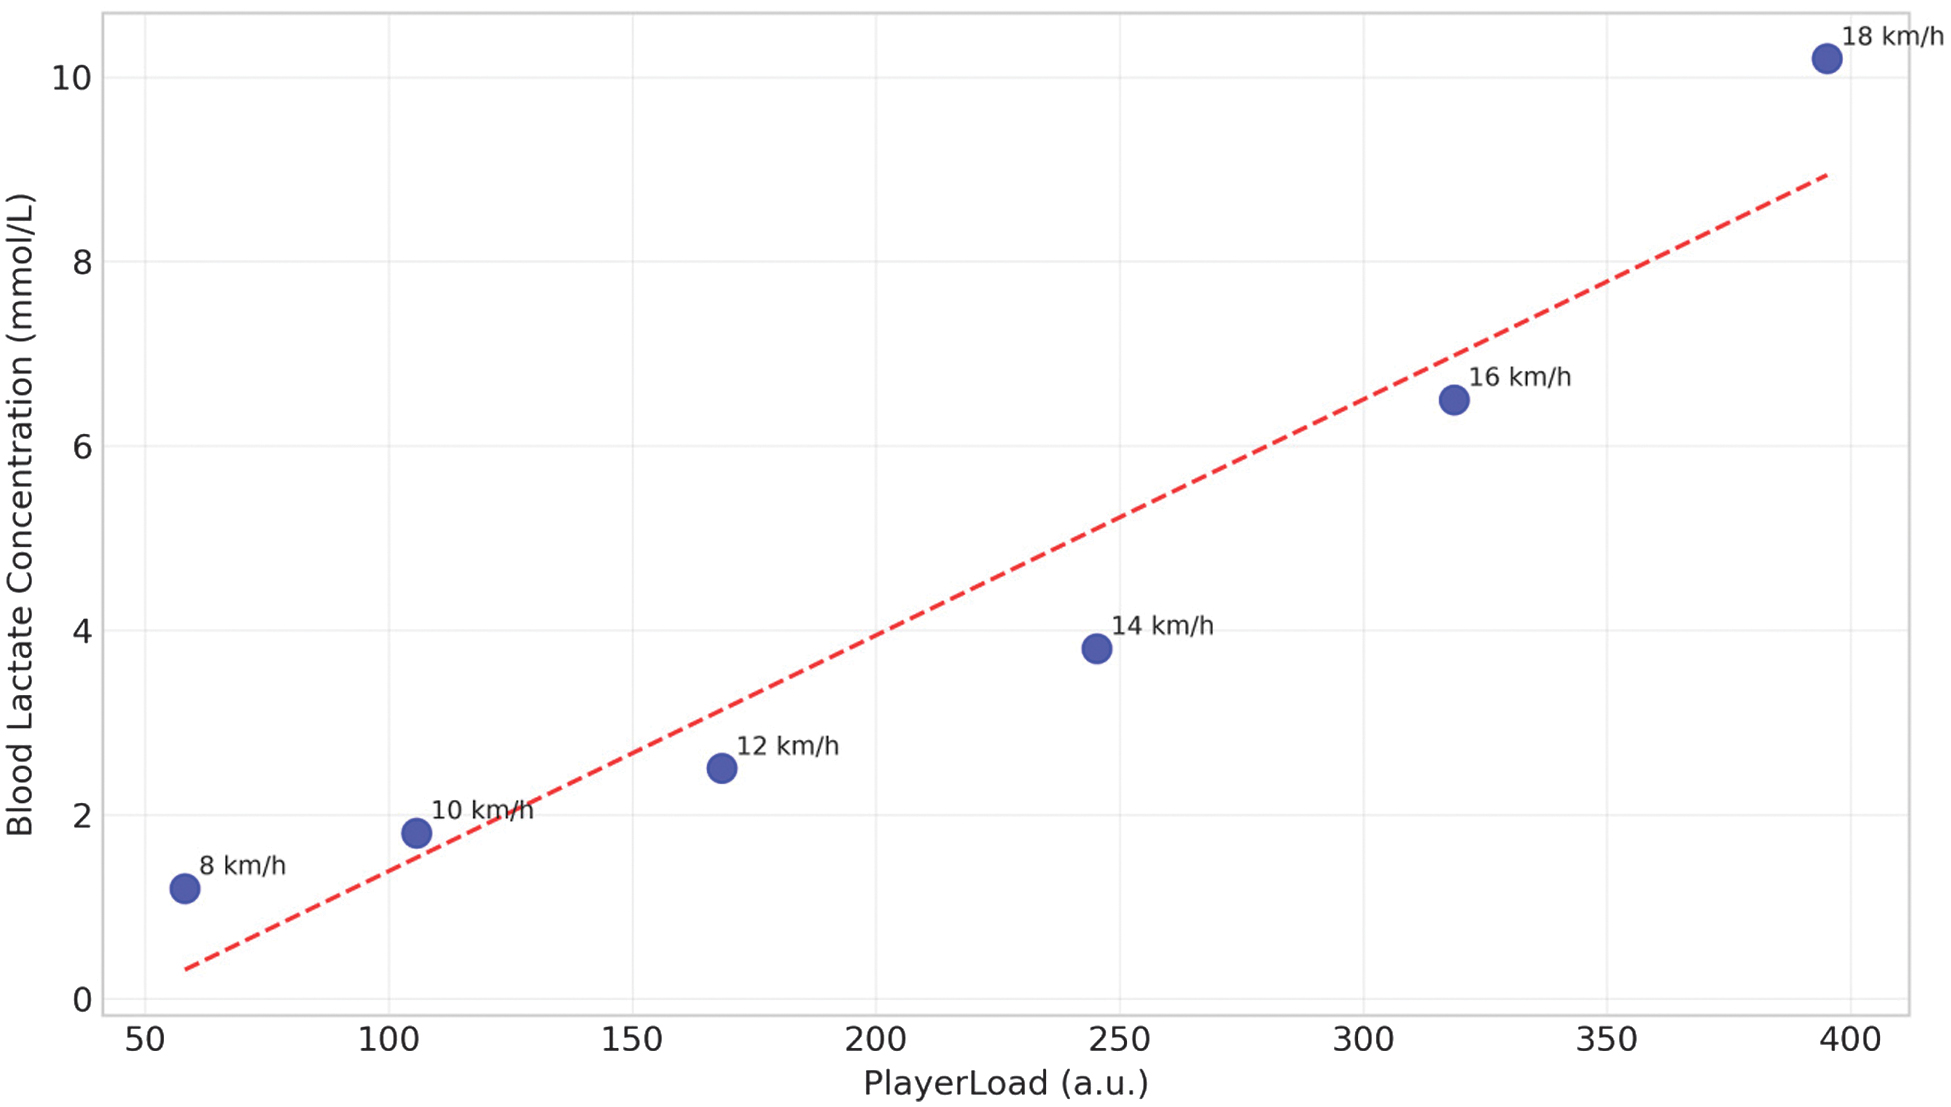 Fig. 3. Correlation between PlayerLoad and blood lactate.
The data presented in Table I quantitatively delineate the robust relationship between the externally measured PlayerLoad and the internally measured blood lactate concentration across a standardized incremental treadmill test. The analysis reveals a strong, positive linear correlation, with a Pearson’s correlation coefficient of r = 0.92 (p < 0.001). The coefficient of determination, R2 = 0.846, indicates that PlayerLoad accounts for 84.6% of the variance observed in blood lactate levels, underscoring its potency as a predictive metric for physiological strain.
Table I. PlayerLoad and corresponding blood lactate concentrations during the incremental treadmill test
| Treadmill speed (km/h) | Stage duration (mins) | PlayerLoad (a.u.) | Blood lactate [La−] (mmol/L) |
|---|---|---|---|
| 8 | 3 | 58.2 ± 5.1 | 1.2 ± 0.3 |
| 10 | 3 | 105.7 ± 8.3 | 1.8 ± 0.4 |
| 12 | 3 | 168.4 ± 12.6 | 2.5 ± 0.5 |
| 14 | 3 | 245.3 ± 15.8 | 3.8 ± 0.7 |
| 16 | 3 | 318.6 ± 20.1 | 6.5 ± 1.2 |
| 18 | 3 | 395.2 ± 25.4 | 10.2 ± 1.8 |
| Cool-down (walk) | 5 | 35.1 ± 4.2 | 8.1 ± 1.5 (post-3 min) |
The progression of data points is physiologically coherent. As treadmill speed increased from 8 km/h to 18 km/h, PlayerLoad demonstrated a corresponding monotonic increase from 58.2 ± 5.1 a.u. to 395.2 ± 25.4 a.u. This was mirrored by an exponential rise in blood lactate, from a baseline of 1.2 ± 0.3 mmol/L to a peak of 10.2 ± 1.8 mmol/L. A critical inflection point was observed at a PlayerLoad of approximately 250 a.u., which corresponded to a blood lactate concentration of ∼4 mmol/L. This value is widely recognized as the Onset of Blood Lactate Accumulation (OBLA), signifying the transition from heavy aerobic to anaerobic metabolism. The regression equation, [La−] = 0.032 × PlayerLoad + 0.875, provides a validated mathematical model for estimating metabolic stress from biomechanical load in real time.
The analysis conclusively demonstrates that PlayerLoad, derived from a single, sacral-mounted IMU within a WSN, serves as a highly valid and reliable surrogate measure for direct physiological intensity monitoring in track and field athletes. The strong correlation with blood lactate, the gold-standard metabolic marker, validates the system’s core functionality. The identification of a specific PlayerLoad threshold (∼250 a.u.) associated with the anaerobic threshold is of paramount practical significance. It allows coaches to move beyond subjective estimation or invasive testing and instead use a simple, real-time metric to precisely control training intensity, individualize workout prescriptions, and objectively demarcate training zones (e.g., aerobic, threshold, and high-intensity). This threshold is particularly relevant for endurance events. For sprint and power events, while the absolute PlayerLoad value per minute might be lower due to shorter durations, the rate of accumulation and peak values during efforts are key indicators of intensity. The system’s ability to classify activities allows coaches to interpret PlayerLoad in the context of the specific drill being performed. This technological advancement facilitates the optimization of athletic performance while providing a data-driven framework to mitigate the risk of non-functional overreaching (NFO) and injury by preventing excessive training loads.
B.LONGITUDINAL STUDY RESULTS
The experimental group demonstrated significantly greater improvements in performance. The mean percentage improvement in season-best times for the EG was 4.7 ± 1.1%, compared to 4.0 ± 1.4% for the CG. An ANCOVA revealed that this difference was statistically significant (F(1, 42) = 9.87, p = 0.003). This represents a 15.3% greater relative improvement for the EG. A subgroup analysis based on primary event type (Sprints/Jumps vs. Middle/Long Distance) showed consistent trends favoring the EG in both subgroups, though the small sample size within each subgroup precludes definitive statistical supports the notion that data-driven training prescription can lead to superior outcomes compared to traditional methods [34].
The system provided granular insights into training. Fig. 4 shows a sample analysis of a single EG athlete’s session, automatically broken down by the activity classifier. It clearly shows the distribution of intensity across different drills, with sprint intervals generating the highest PlayerLoad/min, allowing for precise periodization within a single session [35].
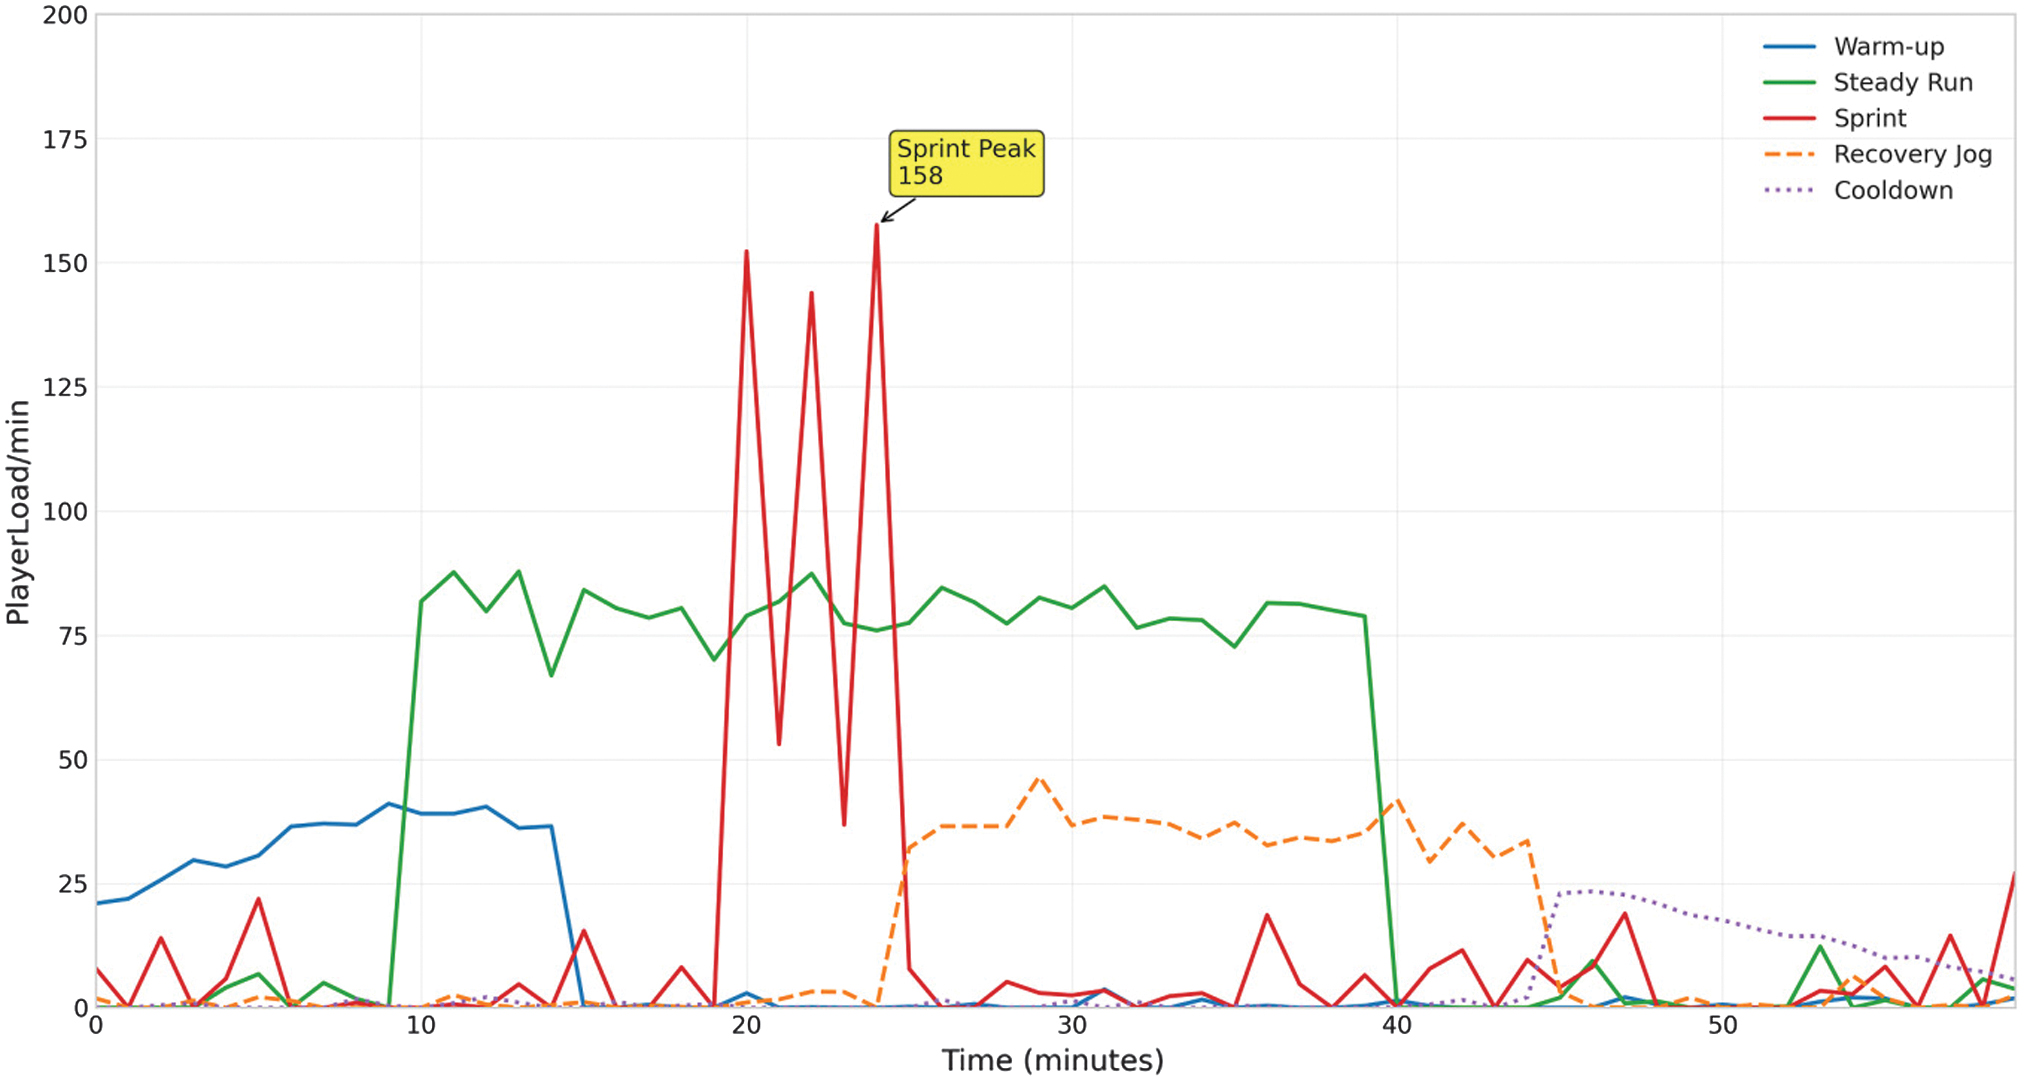 Fig. 4. Intra-session intensity distribution for a sprint workout.
The monitoring of ACWR was critical. Over the 12 weeks, the EG had 78% fewer instances of athletes entering the “high injury risk” zone (ACWR > 1.5) compared to the CG (5 instances vs. 23 instances). This was reflected in the well-being data; the EG reported a 28% lower cumulative score for negative wellness markers (muscle soreness, fatigue) throughout the study period (p < 0.05). NFO was defined operationally as a sustained period (≥ 2 weeks) of elevated ACWR (>1.5) accompanied by a decline in performance times and a consistent report of high fatigue and muscle soreness (scores ≥4 on the 5-point scale) in the wellness questionnaire. This finding is consistent with research showing that monitoring training load can reduce injury risk and improve athlete well-being [36].
Fig. 5 illustrates the longitudinal weekly training load (PlayerLoad) for a sample track and field athlete over a 12-week training period, alongside the critical ACWR. The plot displays the Actual Weekly Load (Acute) and the Chronic Load (4-week rolling average) on the primary y-axis, while bars represent the ACWR on the secondary y-axis. The background is color-coded to denote distinct training phases: Build-up, Recovery/Build, Intensity, and Tapering.
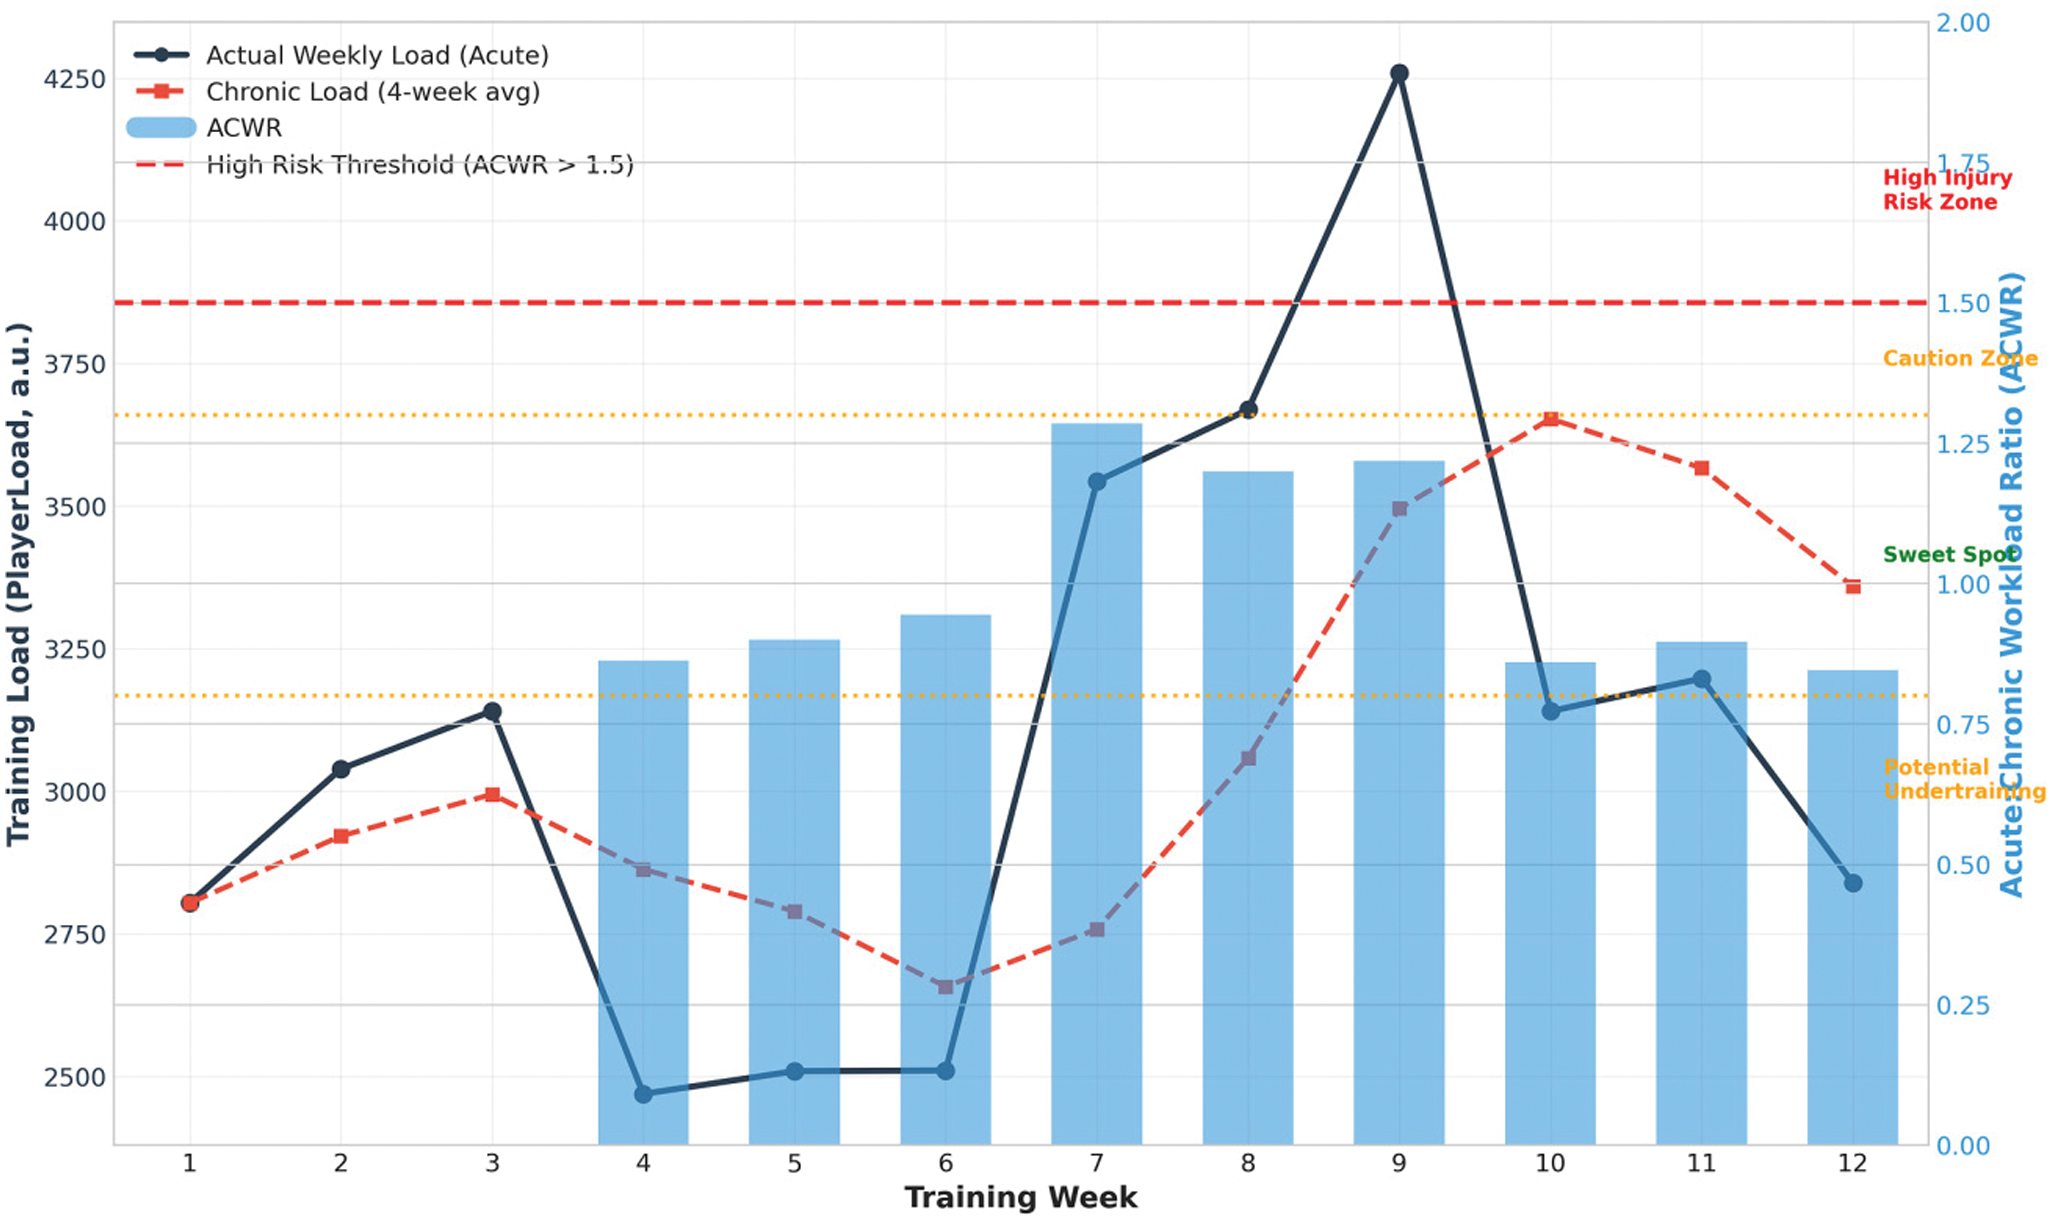 Fig. 5. Longitudinal weekly training load (PlayerLoad) for a sample athlete.
Key observations include a planned periodization, evident from the progressive load increase during the Intensity phase (Weeks 7–9), peaking at approximately 4,300 a.u., followed by a distinct tapering period. The ACWR effectively identifies periods of elevated injury risk, most notably during Week 8 where the ratio exceeds the high-risk threshold of 1.5. This visualization demonstrates the system’s utility in monitoring long-term training progression, validating periodization plans, and providing early warning of potentially excessive load to mitigate injury risk.
C.DISCUSSION
The results strongly support the efficacy of the proposed WSN-based monitoring system. The high correlation with blood lactate (Fig. 3) validates the system’s ability to accurately quantify physiological intensity, moving beyond estimation to direct measurement [32]. The superior performance gains in the EG (15.3% greater improvement) can be attributed to more precise and individualized training prescriptions. Coaches were able to use the objective data to ensure each athlete was training at the optimal intensity—pushing limits when appropriate but also enforcing recovery, which is often neglected in traditional coaching [34].
The most significant impact may be in injury risk reduction. The drastic reduction in high ACWR instances in the EG (Fig. 5) and the corresponding improvement in subjective wellness scores provide compelling evidence that the system effectively prevents non-functional overreaching and potential overtraining syndrome [28,36]. By providing a clear, data-driven warning signal, the system empowers coaches to proactively manage an athlete’s load, a crucial aspect often missing in subjective methods [37].
The successful implementation of the LoRa network proved its suitability for this application. Throughout the study, the packet loss rate was below 3%, and no sensor node required a mid-study battery replacement, confirming the design’s robustness and practicality for daily use in an educational setting, as predicted by earlier LPWAN research [11,24].
VII.CONCLUSION AND FUTURE WORK
This study successfully designed, implemented, and validated a comprehensive WSN-based system for monitoring training intensity in track and field. The system, which integrated IMU and HR sensors with a LoRa communication network and a cloud-based analytics platform, provided a robust, objective, and real-time solution to a long-standing challenge in sports pedagogy. The key findings were as follows:
- (1)The system’s primary intensity metric (PlayerLoad) was highly correlated (r = 0.92) with a gold-standard physiological marker (blood lactate).
- (2)When used to guide training decisions, the system led to significantly greater athletic performance improvements (15.3%) over a 12-week period compared to traditional methods.
- (3)The system demonstrably improved athlete well-being and reduced exposure to high-injury-risk training states by providing objective load management data to coaches.
This work confirmed that technology-driven, data-informed coaching can significantly enhance the effectiveness and safety of physical education and athletic training. The proposed system offered a scalable model for institutions seeking to modernize their sports science infrastructure.
A.LIMITATIONS AND FUTURE WORK
This study had several limitations that point to future research directions. First, the sample consisted of university-level athletes from a single institution, limiting the generalizability of the findings to younger adolescents, elite professionals, or more diverse populations. Future studies should involve larger, more diverse cohorts. Second, the 12-week study period and controlled environment did not fully account for long-term system reliability issues (e.g., sensor data drift, battery degradation over >6 months) or performance under extreme weather conditions (e.g., heavy rain, high temperatures), which could affect sensor adhesion and signal quality. Third, a formal cost–benefit analysis was not conducted; the prototype node cost was approximately $85 per unit, and the scalability of this cost for entire teams warrants further investigation.
Future work will focus on several areas:
- (1)Sensor Fusion Enhancement: Incorporating ultra-wideband (UWB) for precise, real-time location tracking on the track, enabling analysis of pacing and positioning, as explored in recent indoor localization studies [38].
- (2)Advanced Biomechanical Modeling: Using the IMU data to estimate more complex biomechanical variables such as ground reaction forces and joint loading using ML models [39], providing deeper insights into technique and injury mechanisms.
- (3)Predictive Analytics: Developing mode\ls to predict individual athlete performance peaks and injury risk based on longitudinal training load and wellness data, an emerging field in sports analytics [40].
- (4)Integration with Bio-sensing Fabrics: Exploring the use of smart textiles that embed sensors directly into athletic apparel for even greater comfort and usability.
- (5)Long-term and Environmental Testing: Conducting longer-term deployments to assess hardware durability and performing targeted experiments to evaluate system performance under a wider range of environmental conditions.
AUTHORS PROFILE
Zhifang Xiao, Master of Engineering, is an Associate Professor. She graduated from the Chongqing University in 2014 and currently works in Hunan Mechanical and Electrical Polytechnic. Her research interests include physical education training and management.
Wentao Guo, Master of Science in Engineering, is a Professor. He graduated from the Hunan University in 2010 and currently works in Hunan Mechanical and Electrical Polytechnic. His research interests include wireless sensor network.
FUNDING
This work is supported by the Natural Science Foundation of Hunan Province project (number: 2025JJ80310).
CONFLICT OF INTEREST STATEMENT
The authors declared no potential conflicts of interest with respect to the research, authorship, and/or publication of this article.
For this article, no studies with human participants or animals were performed by any of the authors. All studies mentioned were in accordance with the ethical standards indicated in each case.