I.INTRODUCTION
Machine learning (ML) tackles issues related to classification, prediction, and clustering, with a primary focus on achieving high accuracy as the key outcome. This analysis employs Logistic Regression, K-Nearest Neighbours (KNN), Decision Trees (DTs), Random Forest, Naive Bayes, and XGBoost to investigate the occurrence of epileptic seizures.
A significant amount of investigation has been conducted on ML and deep learning (DL) methods for detecting and forecasting epileptic episodes, as well as evaluating therapy responses (Rahman and Sarkar, 2023) [1–9]. Although previous studies are numerous, a significant amount still lacks breadth in their focus [10–18]. Traditional ML models such as KNN, Logistic Regression, and DTs, in conjunction with more sophisticated DL frameworks, have enhanced the processes of diagnosis and intervention. A Random Forest model, for instance, reached an area under the curve (AUC) of 0.979 when evaluated on a dataset comprising 287 patients with demographic, medical, and test information.
Even with this advancement, there remains an absence of thorough comparative evaluations that integrate traditional ML and DL methods within consistent frameworks. There is a scarcity of information regarding the comparative benefits of hybrid DL frameworks, such as convolutional neural network–bidirectional long short-term memory (CNN–BiLSTM), in relation to ML models like Random Forest and Logistic Regression. Navazi and Archer [1] examined hybrid algorithms and optimization methods (Particle Swarm Optimization (PSO) and GA-Support Vector Machine (SVM)), but the extent of their adaptability in medical applications—specifically in electroencephalogram (EEG)-based feature selection and hyperparameter tuning—has not been thoroughly investigated. Additional investigation is required to create optimization algorithms that can be applied to EEG, genetic, and clinical data, enhancing the efficiency and accuracy of models.
The majority of recent investigations concentrate on immediate prediction and classification, with limited attention given to long-term outcomes such as seizure recurrence or the progression of Alzheimer’s disease. Lemoine et al. [3] attained an AUC of 0.63 for one-year seizure recurrence, highlighting the necessity for improved models. The incorporation of ML into various and evolving clinical environments is crucial for dependable long-term prognostic outcomes.
This investigation employs the Epileptic Seizure Recognition dataset (no date), highlighting EEG recordings obtained through the 10–20 International system, which identifies voltage fluctuations to differentiate between “seizure” and “non-seizure” conditions. The dataset includes 11,500 entries of EEG activity recorded over a duration of 23.6 seconds, segmented into 23 parts, each containing 178 data points [19]. The dataset comprises 180 attributes, including X1 through X178, along with the target variable “y”. After gathering the data, an exploratory data analysis (EDA) was conducted to evaluate data quality and inform the strategic division into training, validation, and test sets.
The remainder of this paper is organized as follows. Section II presents the related work and literature review on ML approaches for epileptic seizure detection. Section III describes the research methodology, dataset, and modeling techniques. Section IV details the experimental setup and hyperparameter configuration. Section V presents the results and discussion. Section VI provides recommendations for future work. Finally, Section VII concludes the study.
II.LITERATURE REVIEW
ML and DL techniques have been widely applied in epileptic seizure detection and prediction using EEG data. Several recent studies have demonstrated the effectiveness of intelligent computational models in identifying seizure patterns and supporting clinical decision-making.
Jaishankar et al. [2] proposed a DL-based seizure prediction model that integrates classification techniques to identify seizure patterns from neurological data. Their study demonstrated that DL models are capable of capturing complex nonlinear relationships in EEG signals, leading to improved prediction performance. Similarly, Pattnaik et al. [4] employed an ML approach combined with tunable-Q wavelet transform-based time–frequency features. Their findings indicated that extracting discriminative EEG features significantly enhances seizure detection accuracy, emphasizing the importance of feature engineering.
In addition, hybrid DL architectures have shown promising results. A. K. R. et al. [5] developed a CNN–BiLSTM framework that combines spatial feature extraction with temporal sequence learning. The study revealed that hybrid models outperform single architectures by effectively capturing both spatial and temporal characteristics of EEG signals. Likewise, Spooner et al. [7] conducted a comparative analysis of multiple DL models and found that model performance varies significantly depending on the architecture, highlighting the need for careful model selection.
Comparative ML studies have also contributed to this domain. Gleichgerrcht et al. [9] evaluated multiple ML algorithms for seizure prediction and found that algorithm performance is highly dependent on the dataset and evaluation criteria. Similarly, Senders et al. [11] demonstrated that ML-based predictive models can effectively forecast seizure occurrence, supporting early intervention strategies.
Feature selection remains a critical component in improving classification performance. Harpale and Bairagi [15] proposed an adaptive feature selection and extraction method, showing that selecting relevant EEG features significantly improves classification accuracy. Mursalin et al. [16] further reinforced this by introducing a novel feature selection algorithm combined with statistical sampling, which enhanced seizure classification performance by reducing data redundancy.
Furthermore, comprehensive reviews such as Farooq and Riaz [17] have highlighted key challenges in seizure detection, including model generalizability, dataset variability, and the need for robust evaluation frameworks. These studies collectively indicate that while significant progress has been made, there is still a need for systematic evaluation of multiple ML models under consistent experimental conditions.
Despite the advancements in seizure detection and prediction, several limitations persist in existing studies. Many works focus on individual models, specific feature extraction methods, or DL architectures without providing a comprehensive comparison across multiple ML techniques. Additionally, inconsistencies in datasets, evaluation metrics, and experimental setups make it difficult to identify the most reliable model for practical deployment. Issues such as model generalizability, robustness, and computational efficiency also remain insufficiently addressed. Therefore, this study aims to fill these gaps by conducting a systematic comparative analysis of multiple ML algorithms using a unified dataset and evaluation framework, thereby identifying the most effective approach for epileptic seizure detection and improving the reliability of data-driven clinical decision support systems.
III.RESEARCH METHODOLOGY
This study employed the design science research methodology. Nevertheless, the implementation of the complete study process adheres to the state-of-the-art ML research methodology.
A.DEEP DATASET STRUCTURE AND PREPARATIONS
Data preprocessing is a critical step to ensure dataset quality and support accurate modeling. This study processes the epileptic seizure dataset from the Kaggle as the primary source which they obtained from UCI Machine Learning Repository to prepare it for analysis [20].
The Epileptic Seizure Recognition dataset from the UCI Machine Learning Repository was selected due to its credibility, public accessibility, and widespread use as a benchmark in seizure detection research. The dataset provides 11,500 segmented EEG instances with 178 structured numerical features, making it suitable for comparative evaluation of classical ML models without extensive raw signal preprocessing. Its relatively balanced class distribution supports fair model assessment, while the standardized 10–20 EEG recording system enhances clinical relevance. Overall, the dataset aligns with the study’s objective of reproducible, controlled, and systematic model comparison.
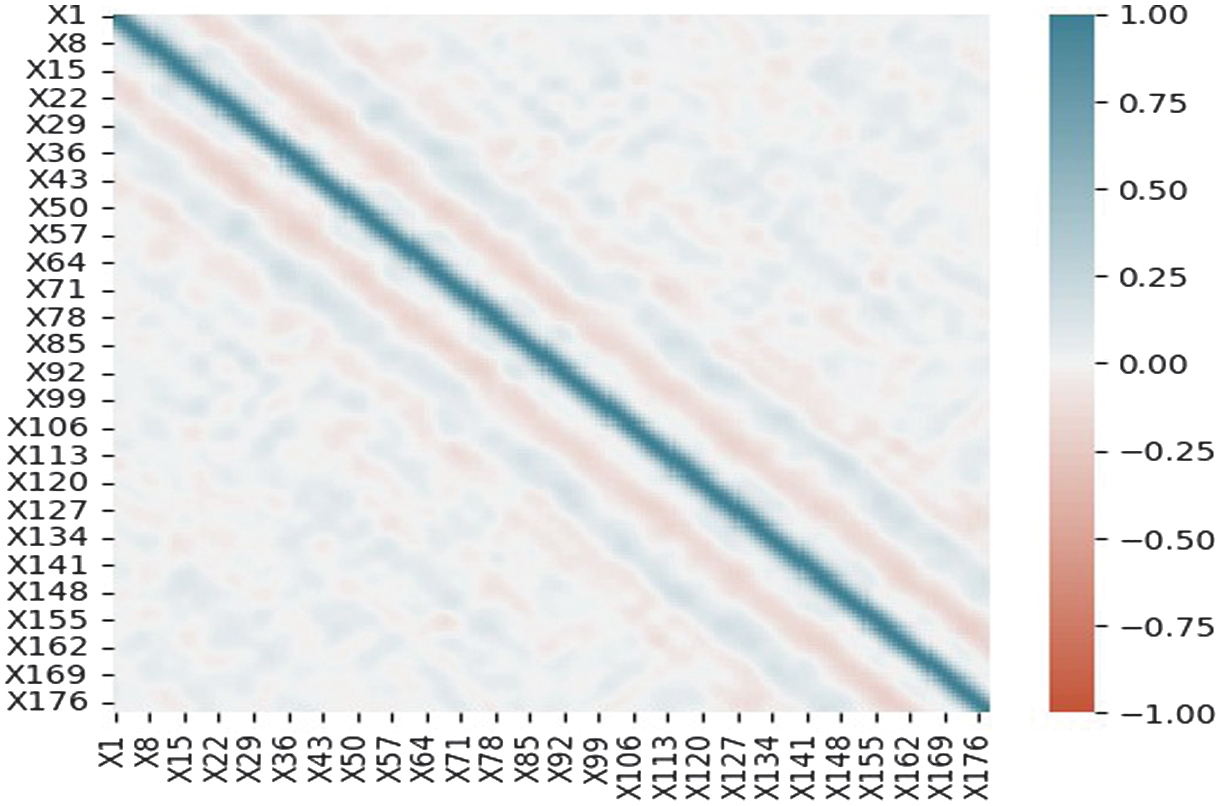
Descriptive statistics reveal feature distributions and central tendencies, while correlation analysis (Fig. 1) identifies patterns for feature selection. EEG waveform visualizations help detect anomalies and trends. Class distribution analysis shows a nearly balanced dataset, minimizing bias. Any imbalance between seizure and non-seizure instances was addressed by adjusting the target variable to achieve better representation.
B.THE MODELING TECHNIQUE
Several modeling techniques are applied for seizure detection. Figure 2 illustrates the general workflow for epileptic seizure prediction using EEG data from the UCI repository. The process begins with data preprocessing, where raw EEG signals are cleaned and prepared. Next, the data are passed to the ML or DL model preparation stage, where relevant features are selected and transformed for modeling. The prepared dataset is then used in the model training phase to build predictive models. Finally, the trained models undergo evaluation and validation to assess their performance and ensure reliability before deployment.
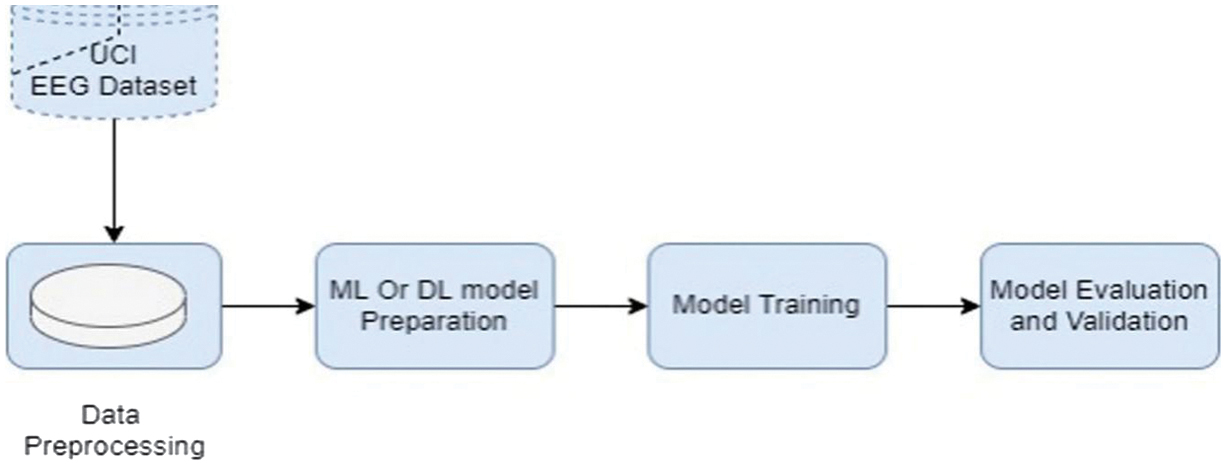 Fig. 2. The general system architecture.
1).LOGISTIC REGRESSION
Logistic Regression is used to predict whether a patient is experiencing an epileptic seizure based on EEG signals. It assumes a linear relationship between EEG features and the log-odds of seizure occurrence. Using the logistic function, probabilities of seizure are calculated [21]. Thresholding these probabilities gives the final seizure prediction;
Logistic Regression was selected as a baseline linear classifier. Since EEG datasets may contain both linear and nonlinear separability characteristics, Logistic Regression provides a benchmark to evaluate whether seizure patterns can be captured through linear decision boundaries. Including it allows us to objectively measure the added value of more complex nonlinear models.
2).KNN
This is a one of the most important supervised ML technique that its name is derived for the parameters associated with the numbers of neighborhood. KNN is especially advantageous for classification problems involving data that cannot be separated by a linear boundary. The KNN algorithm is employed in the model to recognize epileptic seizures based on EEG signals. KNN categorizes input data by considering the most fitted region among the K closed neighbors.
KNN was chosen because EEG feature space may exhibit local neighborhood structures, where seizure patterns cluster in feature space. As a nonparametric model, KNN makes minimal assumptions about data distribution, making it suitable for biomedical datasets where underlying distributions may be unknown.
3).DECISION TREES (DTs)
In general, a DT for binary classification applies a sequence of simple, rule-based splits on input features to guide the classification process. For instance, an illustrative criterion could be “If feature1 > 0.5, move to the left branch”, “If feature2 ≤ 1.0, move to the right branch”, and “If feature1 ≤ 0.5 and feature2 > 1.0, move to the left branch.” Such rules are applied recursively, with each split narrowing the decision path until a leaf node (final decision) is reached, where a class label is assigned. Rather than being expressed as a single mathematical equation, this structure operates as a hierarchy of branching rules [22].
DTs were selected due to their interpretability and rule-based structure, which is important in medical applications. Clinicians can understand decision paths, making DTs useful for explainable seizure classification.
4).RANDOM FOREST CLASSIFIER
An ensemble of DTs built from random subsets of data and features. Predictions are aggregated via majority voting. Parameters: max_depth = 10 limits tree complexity, and random_state = 69 ensures reproducibility. It uses bootstrapping and random feature selection to promote diversity [23,24].
Random Forest was included because EEG data is high-dimensional (178 features), and ensemble learning reduces overfitting while handling feature interactions effectively. Random Forest (RF) is known for strong performance in biomedical classification, robustness to noise, and built-in feature importance estimation. Given the complexity of EEG signals, RF is theoretically well suited.
5).XGBOOST CLASSIFIER
Lastly, we employ the XGBoost classifier, a popular implementation of gradient-boosted DTs. The XGBoost algorithm optimizes an objective function, which is a sum of a loss function and a regularization term. XGBoost is a gradient boosting algorithm, which means it builds an ensemble of weak learners (trees) sequentially. Each new tree in the ensemble corrects the errors of the previous ones. Regularization: XGBoost includes regularization terms to control model complexity and prevent overfitting [25]. Prediction: After training, the XGBoost model can predict the class labels (in your case, for epileptic seizure recognition) based on the learned patterns from the training data.
XGBoost was chosen because it is a state-of-the-art gradient boosting framework known for handling complex nonlinear interactions, regularization mechanisms to prevent overfitting, and strong performance in structured/tabular data. Since the UCI EEG dataset is structured tabular data, XGBoost is particularly suitable.
6).DL MODEL
The DL model architecture outlined is tailored for epileptic seizure prediction. It comprises input, hidden, and output layers. The input layer uses BatchNormalization to standardize data, ensuring stability during optimization. Hidden layers consist of Dense layers with Rectified Linear Unit (ReLU) activation, promoting nonlinearity for learning complex patterns. BatchNormalization stabilizes training, and Dropout prevents overfitting. The output layer, a Dense layer with sigmoid activation, predicts seizure likelihood. This architecture processes 178 features, employing normalization and regularization to enhance accuracy. Training utilizes optimization algorithms to minimize loss and optimize parameters [26].
Contemporary research underscores the efficacy of advanced DL architectures for epileptic seizure detection. Studies demonstrate that CNNs and Recurrent Neural Network (RNNs) significantly outperform traditional methods by automatically learning optimal features from raw EEG data [27,28]. Hybrid models, such as CNN–LSTM and CNN–RNN cascades, are particularly effective, capturing critical spatio-temporal dependencies for high-accuracy, real-time prediction suitable for wearable sensors [29–33]. For clinical deployment, lightweight 1D-CNNs offer a low-computational solution [34–36], while optimized temporal convolutional networks (TCNs) meet the low-latency demands of real-time warning systems [37]. To improve generalization across subjects, transfer learning has proven successful [33], and other architectures like vision transformer ensembles [35] and graph neural networks (GNNs) modeling brain connectivity show robust performance by identifying complex, nonlocal patterns [36]. Furthermore, applying explainable AI (XAI) techniques is crucial for increasing clinical trust by making model decisions interpretable [31].
IV.EXPERIMENTAL SETTING AND HYPERPARAMENTERS
This paper provides a comprehensive description of the experimental setup, strategy, methodologies, evaluation measures, hyperparameter tuning process, and presentation of the outcomes. Typically, the experiment is aimed to effectively illustrate the effectiveness and dependability of the methods used in the research [38–40]. The experiment was conducted using the Python programming language. The necessary hyperparameters for each of the specified algorithms are as follows: Logistic Regression Penalty: Refers to the criterion used for imposing penalties (regularization term). The alternatives that can be chosen are “l1”, “l2”, “elasticnet”, and “none”. C: The reciprocal of the regularization strength; lower numbers suggest a greater degree of regularization. Solver: The algorithm to be used in the optimization task. The alternatives that can be selected include “newton-cg”, “lbfgs”, “liblinear”, “sag”, and “saga”. The term “max_iter” denotes the maximum number of iterations that the solvers can do in order to achieve convergence. The L1_ratio parameter: The Elastic-Net mixing parameter is a numerical number ranging from 0 to 1, including both endpoints. It is specifically used when the penalty is set to “elasticnet”. KNN n_neighbors: The number of adjacent data points to use. Weights: The weight function used in the prediction procedure. The alternatives that can be chosen include “uniform”, “distance”, or a user-defined function. An algorithm is a step-by-step procedure or set of rules for solving a problem or accomplishing a specific task.
Whether bootstrap samples are used in tree construction is determined. The “oob_score” parameter determines whether to use out-of-bag data for assessing the generalization accuracy. The “random_state” option is utilized to regulate the degree of randomization in the estimator. The XGBoost classifier utilizes the “n_estimators” option to ascertain the quantity of gradient-boosted trees to be employed in the boosting iterations. The learning rate is a parameter that controls the amount of the steps taken during updates to minimize overfitting. max_depth: The upper limit on the number of layers in a tree. min_child_weight: The minimal combined weight (hessian) that a child instance must have in order to be considered. Gamma is the minimum loss reduction required to construct a new partition on a leaf node. Subsample refers to the fraction of samples that will be utilized for training the individual base learners. The “colsample_bytree” parameter controls the proportion of features that will be randomly chosen for each tree. The “reg_alpha” parameter corresponds to the L1 regularization term that is applied to the weights, commonly referred to as alpha. The term “reg_lambda” represents the L2 regularization term applied to the weights, written as lambda. The scale_pos_weight parameter is utilized to equalize the weights of positive and negative instances. ML model performance can be enhanced by adjusting hyperparameters through techniques such as grid search, random search, or more sophisticated methods like Bayesian optimization.
Hyperparameter optimization was conducted systematically to ensure fair and reproducible model comparison. Logistic Regression, KNN, DT, and Random Forest were tuned using grid search with 5-fold cross-validation, while XGBoost was optimized using Randomized Search due to its larger and more complex parameter space. The neural network model was tuned using validation-based monitoring with early stopping to prevent overfitting. The search spaces included key parameters such as the number of estimators, maximum tree depth, learning rate, regularization coefficients (L1/L2), minimum child weight, subsample ratio, and number of neighbors (for KNN). For Logistic Regression, penalty type, solver, and regularization strength were explored. The primary model selection metric was the F1-score, given its balanced consideration of precision and recall in seizure detection, while AUC was used as a secondary performance indicator. Early stopping was applied based on validation loss with a defined patience threshold. This structured optimization framework ensures methodological rigor and reproducibility of results.
V.PRESENTATION OF RESULTS AND DISCUSSION
The experimental results are presented in Table I, which summarizes the effectiveness of various models in detecting epileptic seizures, utilizing standard evaluation metrics such as accuracy, precision, recall, F1-score, and AUC. In a similar vein, the discovery pertains to the correlation involving the number of neighbors (k-values). The Logistic Regression model exhibits the least performance among the various models, achieving an accuracy rate of 63.05%. The relatively low metrics for precision, recall, F1-score, and AUC indicate challenges in effectively distinguishing between genuine positive and true negative instances. This model demonstrates insufficient reliability in identifying epileptic seizures, as it frequently misclassifies a significant number of cases.
Table I. The summary of the experimental results
| Model | Accuracy (%) | Precision | Recall | F1-score | AUC |
|---|---|---|---|---|---|
| Logistic Regression | 63.05 | 0.638 | 0.630 | 0.627 | 0.611 |
| K-Nearest Neighbors | 78.25 | 0.847 | 0.782 | 0.778 | 0.996 |
| Decision Tree | 92.20 | 0.922 | 0.922 | 0.922 | 0.922 |
| Random Forest | 98.31 | 0.983 | 0.983 | 0.983 | 0.999 |
| Naïve Bayes | 92.64 | 0.931 | 0.927 | 0.926 | 0.983 |
| XGBoost | 98.59 | 0.989 | 0.989 | 0.989 | 0.999 |
The KNN algorithm shows a significant improvement over Logistic Regression, reaching an accuracy rate of 78.25%. A precision value of 0.847 indicates a minimal occurrence of false positives, demonstrating its effectiveness in accurately identifying positive instances. Conversely, a commendable recall value of 0.782 indicates that it accurately identifies a significant portion of the true positive instances. The AUC value of 0.996 demonstrates exceptional precision in distinguishing between positive and negative groups. Nonetheless, it presents opportunities for improvement when evaluated against alternative models.
The DT model shows an impressive accuracy of 92.20%, with well-balanced precision, recall, and F1-score, all at 0.922. The findings indicate that the model is proficient in detecting epileptic seizures, exhibiting a low rate of both false positives and false negatives. The AUC, recorded at 0.922, demonstrates a strong capacity of the model to distinguish between seizure and non-seizure events.
The Random Forest model demonstrates exceptional performance, attaining an accuracy of 98.31% along with nearly flawless precision, recall, and F1-score, all recorded at 0.983. The AUC value of 0.999 indicates that the model can effectively distinguish between seizure and non-seizure instances with remarkable accuracy. The Random Forest algorithm shows significant efficacy in detecting epileptic seizures.
The Naïve Bayes classifier shows an impressive accuracy rate of 92.64% and displays strong performance metrics overall. The precision (0.931), recall (0.927), and F1-score (0.926) show slight enhancements over the DT model; however, they do not reach the performance levels of the Random Forest and XGBoost models. The AUC value of 0.983 indicates outstanding performance in classification tasks. Naïve Bayes demonstrates reliability, yet it does not excel as the top performer in this specific scenario.
XGBoost exhibits exceptional performance across all metrics, achieving an accuracy rate of 98.59%. The precision, recall, and F1-score, each at 0.989, indicate an exceptional level of accuracy, implying that the model experiences very few misclassifications. The AUC value of 0.999 signifies an exceptional ability to distinguish between positive and negative cases, reflecting outstanding performance. This analysis identifies XGBoost as the most effective model for detecting epileptic episodes.
The performance of the DL model across numerous training and testing epochs. The four key metrics represented in the graph during the training phase are loss, validation loss, accuracy, and validation accuracy. The horizontal axis represents epochs ranging from 0 to 150, while the vertical axis displays the corresponding metric values. This image illustrates the transformation in the model’s learning process through training. We can further evaluate its capacity for generalization. The blue curve shows a consistent decline in training loss. This enables the model to minimize its error function and identify valuable patterns within its training data. The validation loss shows a decrease at first, followed by a stabilization as indicated by the green curve. This indicates that the model performs effectively on unseen data and avoids overfitting. Nonetheless, the red and orange curves represent the accuracy of training and validation. Both metrics consistently hover around 0.9 during the training process. The classification is functioning effectively. The model’s closely aligned training and validation accuracies suggest effective performance on new data, demonstrating neither overfitting nor underfitting. The validation loss and accuracy curves exhibit typical performance variations over time, often attributed to data sampling or batch effects. All curves exhibit stability, suggesting that the model has been effectively integrated. The model demonstrates effective training, as evidenced by low training and validation loss, alongside stable and high accuracy (Fig. 3). The graph indicates effective optimization and robust generalization. The model comprehended the data structure and generated precise predictions on both the training and validation datasets.
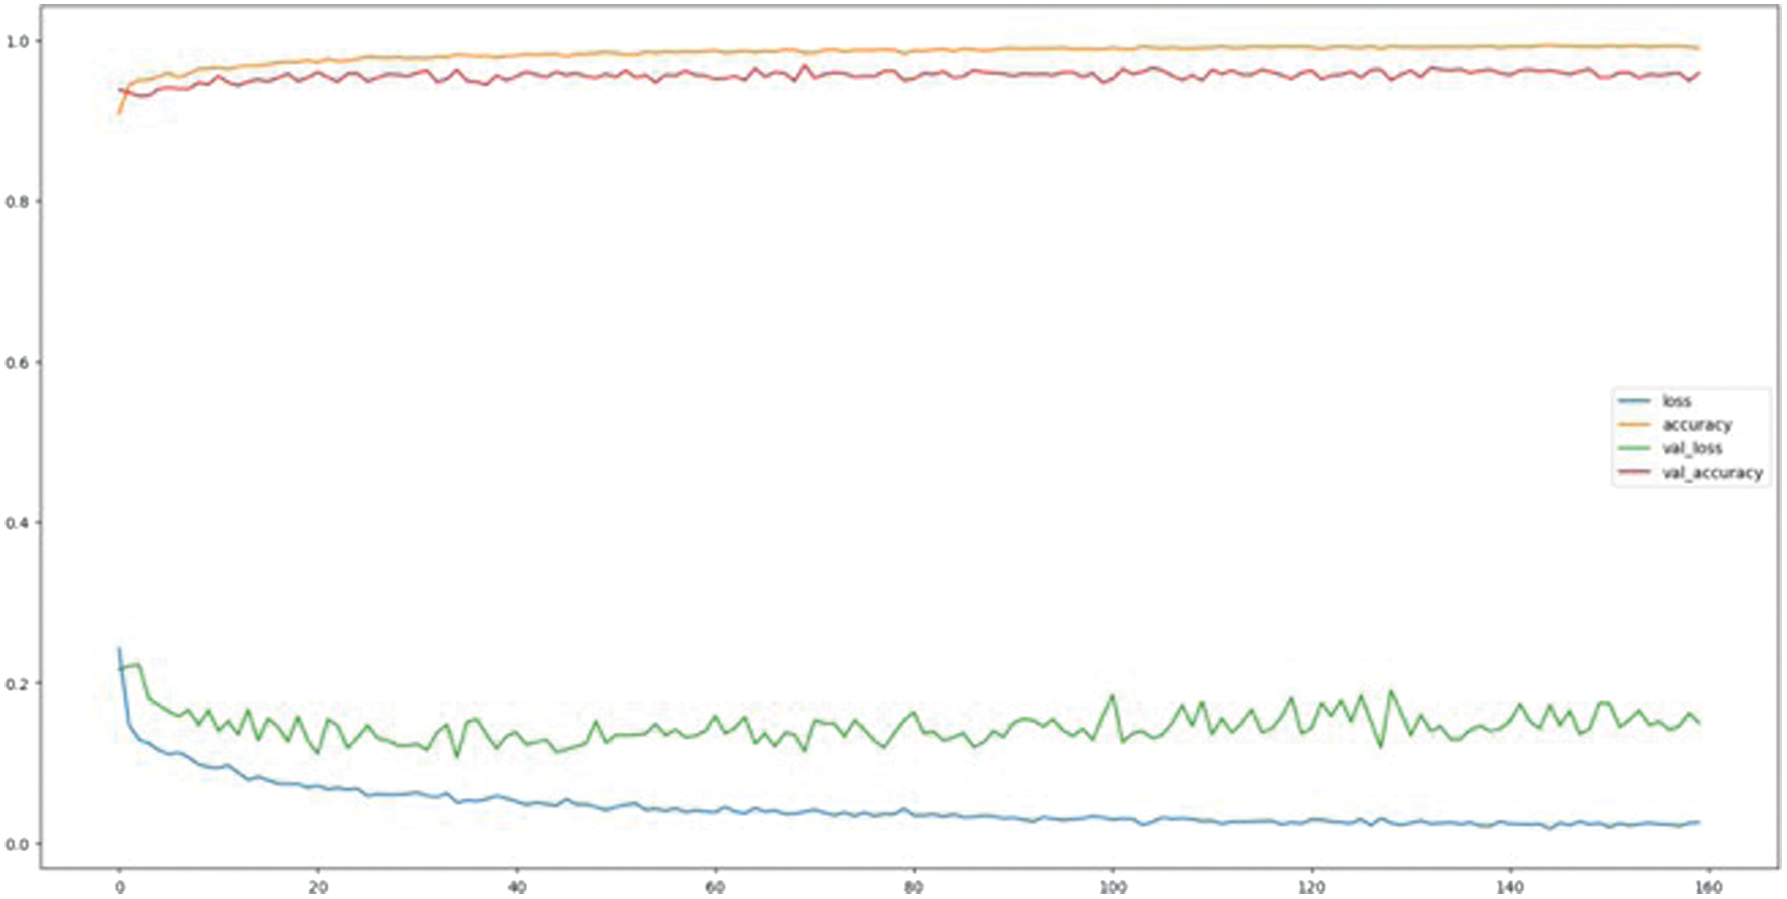 Fig. 3. Neural network results.
Figure 4 depicts a downward trend in the performance metric of a model, likely indicating a decrease in accuracy or F1-score over several iterations or epochs. The horizontal axis denotes the iteration count, which varies from 1 to 9, whereas the vertical axis illustrates the associated performance metric, ranging from 0.97 to 1.00. This plot is frequently utilized to assess the progression of a model’s predictive performance over successive training iterations, modifications in features, or adjustments in parameters. In the initial phase (iteration 1), the model demonstrates nearly flawless performance, with a value approaching 1.000, indicating outstanding initial predictive accuracy or fit. As iterations continue, a noticeable decline emerges, indicating a subtle yet steady decrease in model performance. Between iterations 1 and 4, the metric shows a relatively stable trend, decreasing slightly from 0.998 to 0.990. This observation may suggest that the model is starting to experience overfitting or diminishing returns in generalization from further training.
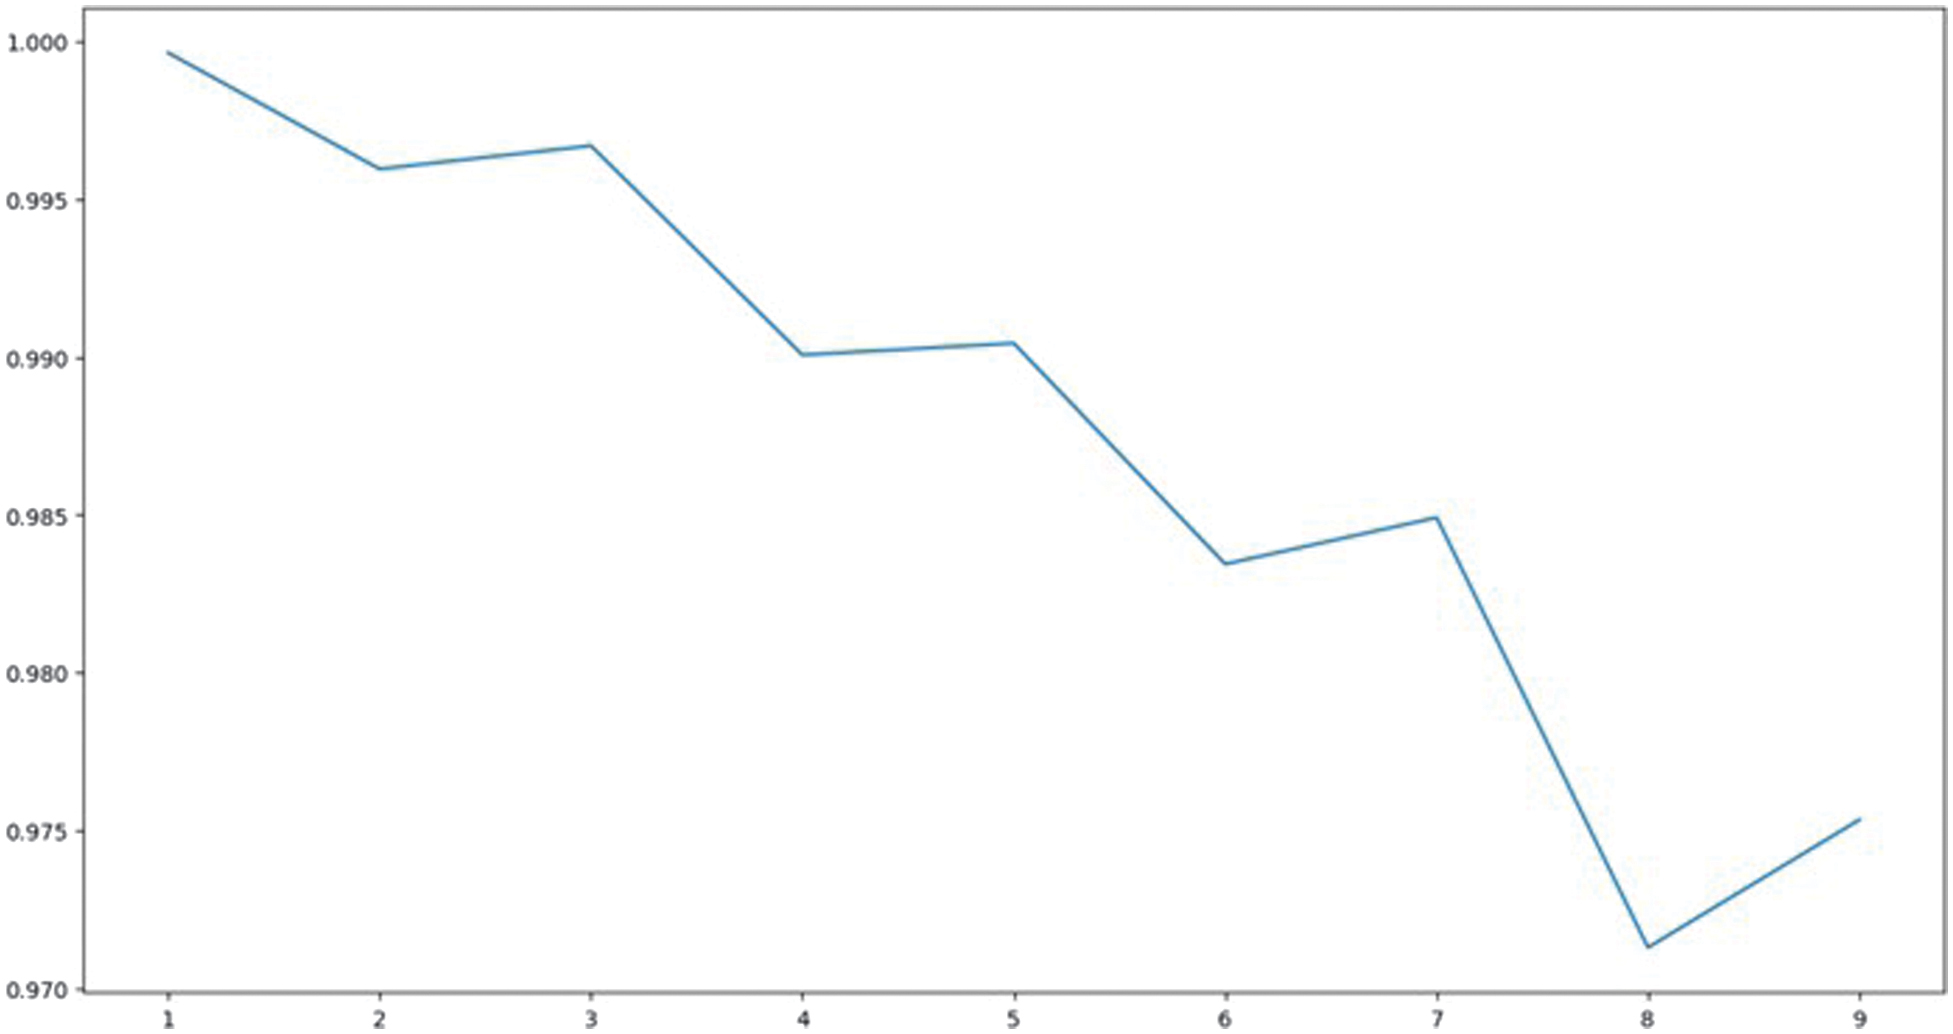 Fig. 4. Plot showing the relationship between the number of neighbors (k-values).
Following the fifth iteration, the decrease becomes increasingly evident, with performance consistently diminishing until it hits its lowest point (around 0.975) at the eighth iteration. This decline probably indicates reduced benefits from additional training or model enhancements—potentially due to overfitting, the buildup of data noise, or fluctuations in learning rates. The slight increase observed at iteration 9 indicates a potential recovery, which may be attributed to adaptive learning processes or random variations in the validation dataset.
The performance of the model is contingent upon the training data utilized, as illustrated in Fig. 5. Precision evaluates effectiveness. The horizontal axis displays a cross-validation setup with a value of 5, along with splits of 50%, 60%, and 70%. The accuracy values observed fall between 0.970 and 0.978 on the vertical axis. This image illustrates the impact of training data on model predictions. At 50% training, the model achieves an accuracy of 0.970. The model demonstrates satisfactory performance; however, it might lack sufficient data to uncover intricate relationships within the dataset. The accuracy has increased to 0.972 with 60% of the training data utilized. This indicates that an increase in data enhances the generalization of the model. The peak accuracy achieved is 0.978 with 70% of the data allocated for training, representing a distinct performance pinnacle. The model achieves optimal learning when it comprehends patterns and possesses sufficient validation data to prevent overfitting. The performance decreases to 0.975 when utilizing 5-fold cross-validation (CV = 5). The averaging of results across multiple validation folds could account for this slight decrease. This enhances generalization while reducing peak performance in comparison to a fixed split.
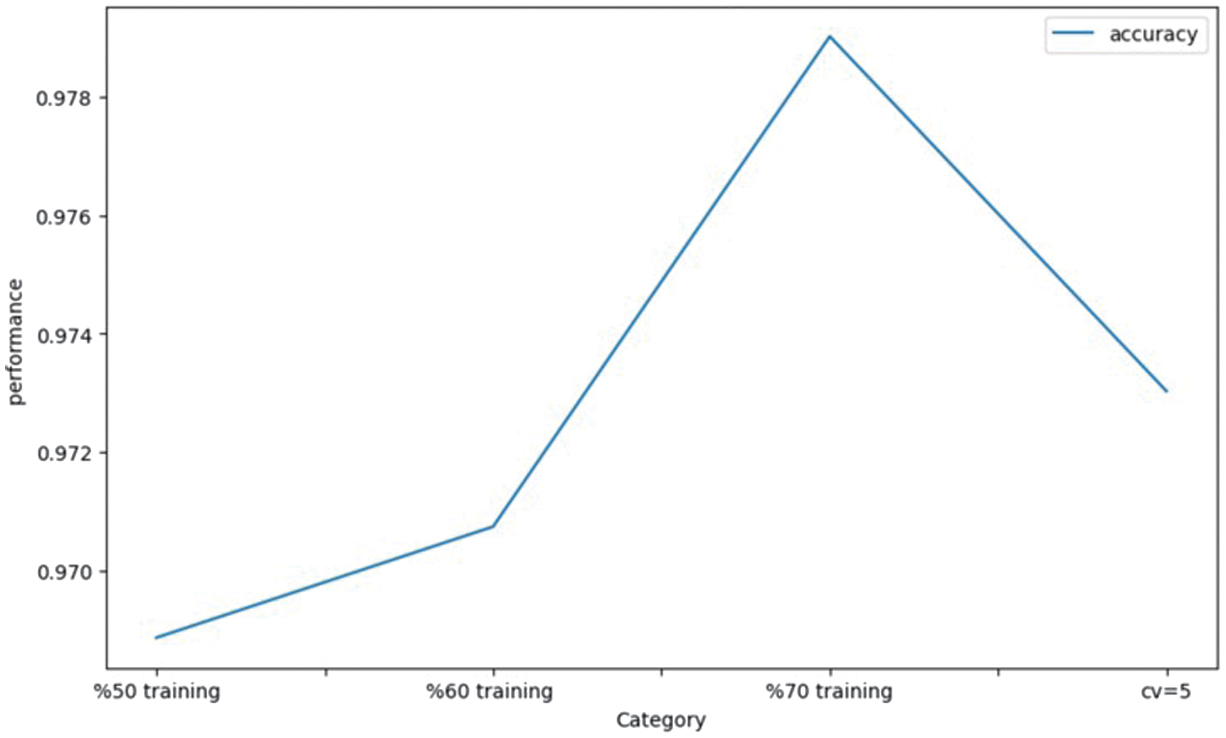 Fig. 5. Bar plot of different training method on RF.
Figure 5 illustrates that the accuracy of the model enhances with the increase in training data, reaching an optimal level. The performance subsequently reaches a state of stability or experiences a downturn. This indicates that there needs to be a careful balance between training size and validation strategy to achieve reliable, high-performing, and generalizable model outcomes.
Figure 6 illustrates the classification performance of seven distinct ML models: XGBoost, Random Forest, Neural Network, Naïve Bayes (NB_model), DT, KNN, and Logistic Regression. Success was evaluated based on precision. The vertical axis represents model performance expressed as a percentage, while the horizontal axis enumerates the various models. Bar charts illustrate the effectiveness of each algorithm in making predictions. The model demonstrating the greatest accuracy is XGBoost, achieving a rate of 98.59%. Optimization through gradient boosting, along with intricate, nonlinear feature interactions, enhances its learning capabilities and generalization performance. The second position is held by Random Forest, achieving a score of 98.31%. Ensemble averaging is effective in minimizing variance and mitigating overfitting. The Neural Network achieves a ranking of third with a score of 95.91%, indicating its proficiency in identifying nonlinear patterns, although it demonstrates less consistency compared to tree-based ensembles. The Naïve Bayes model achieved a score of 92.64%, while the DT followed closely with a score of 92.20%, indicating comparable performance between the two approaches. Their performance is satisfactory; however, the marginally reduced accuracies could be attributed to overfitting in high-dimensional datasets and their sensitivity to correlated features. The KNN algorithm exhibits a performance rate of only 78.25% due to an abundance of features and its sensitivity to noise or unscaled data. Ultimately, Logistic Regression demonstrates the lowest accuracy at 63.05%, suggesting its limitations in modeling intricate, nonlinear relationships within the dataset.
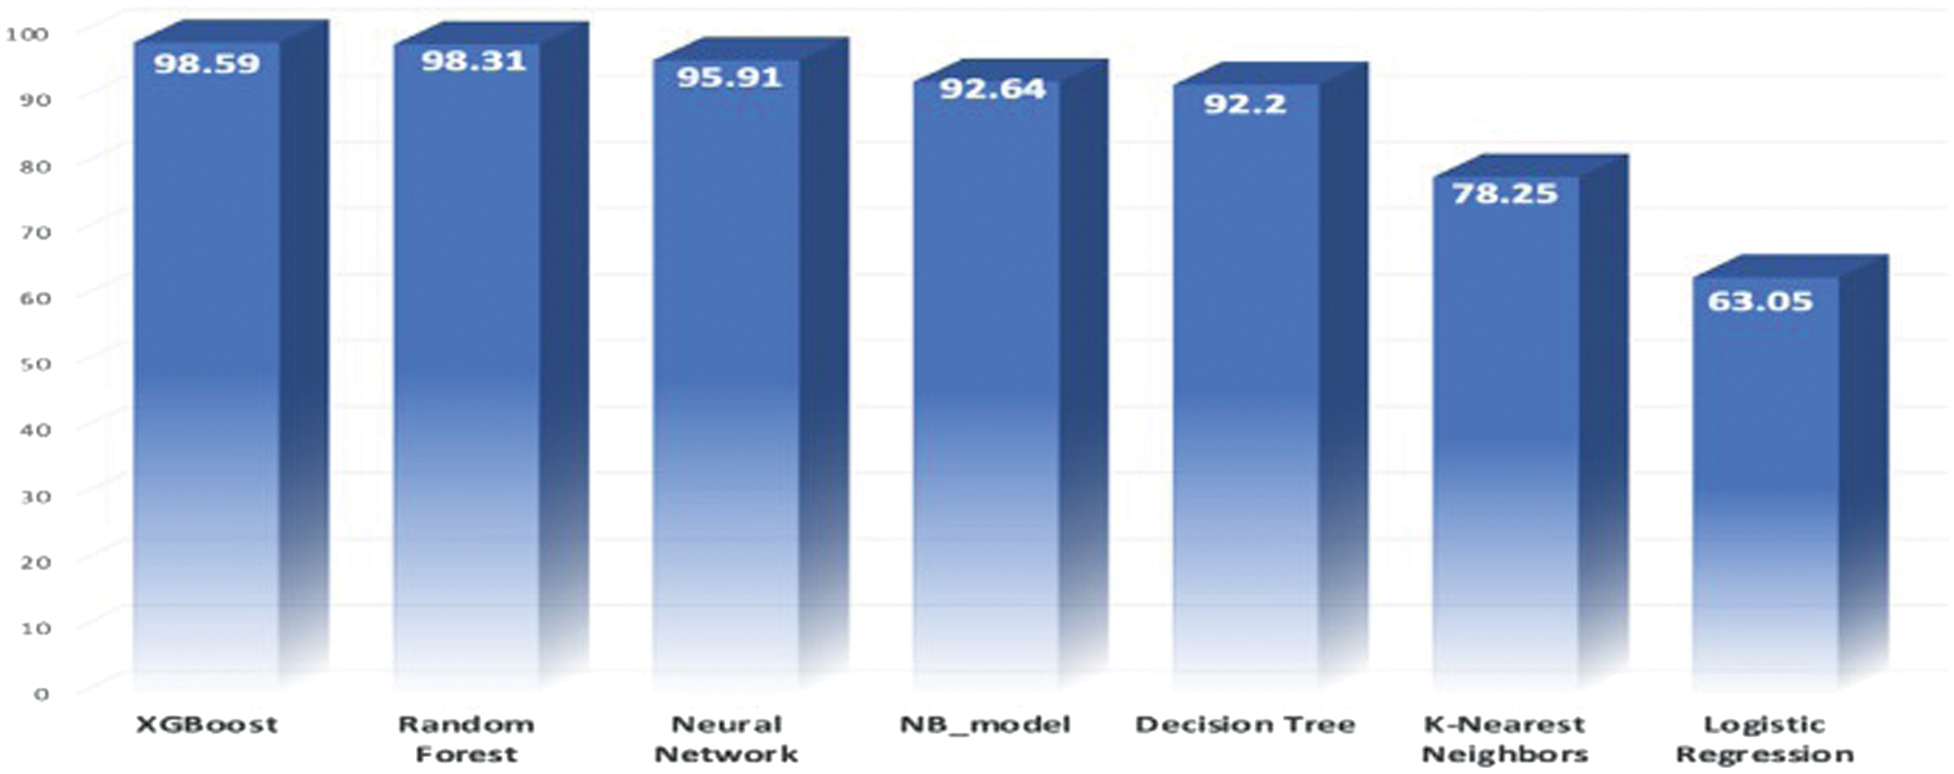 Fig. 6. Plotting the Receiver Operating Characteristic (ROC) curve.
Figure 7 illustrates the ROC curves for five distinct ML models: Logistic Regression (logr), Random Forest, Neural Network, Naïve Bayes, and XGBoost. Each model underwent testing using the identical dataset. The horizontal axis represents the False Positive Rate (1–Specificity), while the vertical axis denotes the True Positive Rate (Sensitivity). The colored lines illustrate the performance of each model across various decision thresholds, highlighting the balance between sensitivity and specificity. The presence of curves in the top-left corner enhances the model’s distinguishing capability. The most effective models include XGBoost and Random Forest. The curves nearly reach the upper-left corner, with AUC values approaching 1.0 (0.9998 and 0.9989). The data illustrate the effectiveness of the classification in minimizing false positives and negatives, achieving near perfection. The Neural Network achieves a second-place ranking with an AUC of 0.989, demonstrating strong predictive accuracy and effective threshold generalization. The Naïve Bayes model demonstrates strong performance with an AUC of 0.978, reflecting high sensitivity even while relying on simplified independence assumptions. Logistic Regression, exhibiting an AUC of 0.8342, demonstrates the least favorable performance. This results in a limited ability to capture intricate, nonlinear data relationships. The diagonal dashed line represents the performance of the baseline random classifier, indicating an AUC of 0.5. All plotted models are positioned above this line, signifying effective learning and significant predictions. Figure 7 illustrates that ensemble-based and DL models demonstrate superior performance compared to linear algorithms. XGBoost and Random Forest demonstrate strong reliability for intricate, high-dimensional classification challenges, as evidenced by their elevated AUC scores. This renders them highly suitable for essential predictive applications.
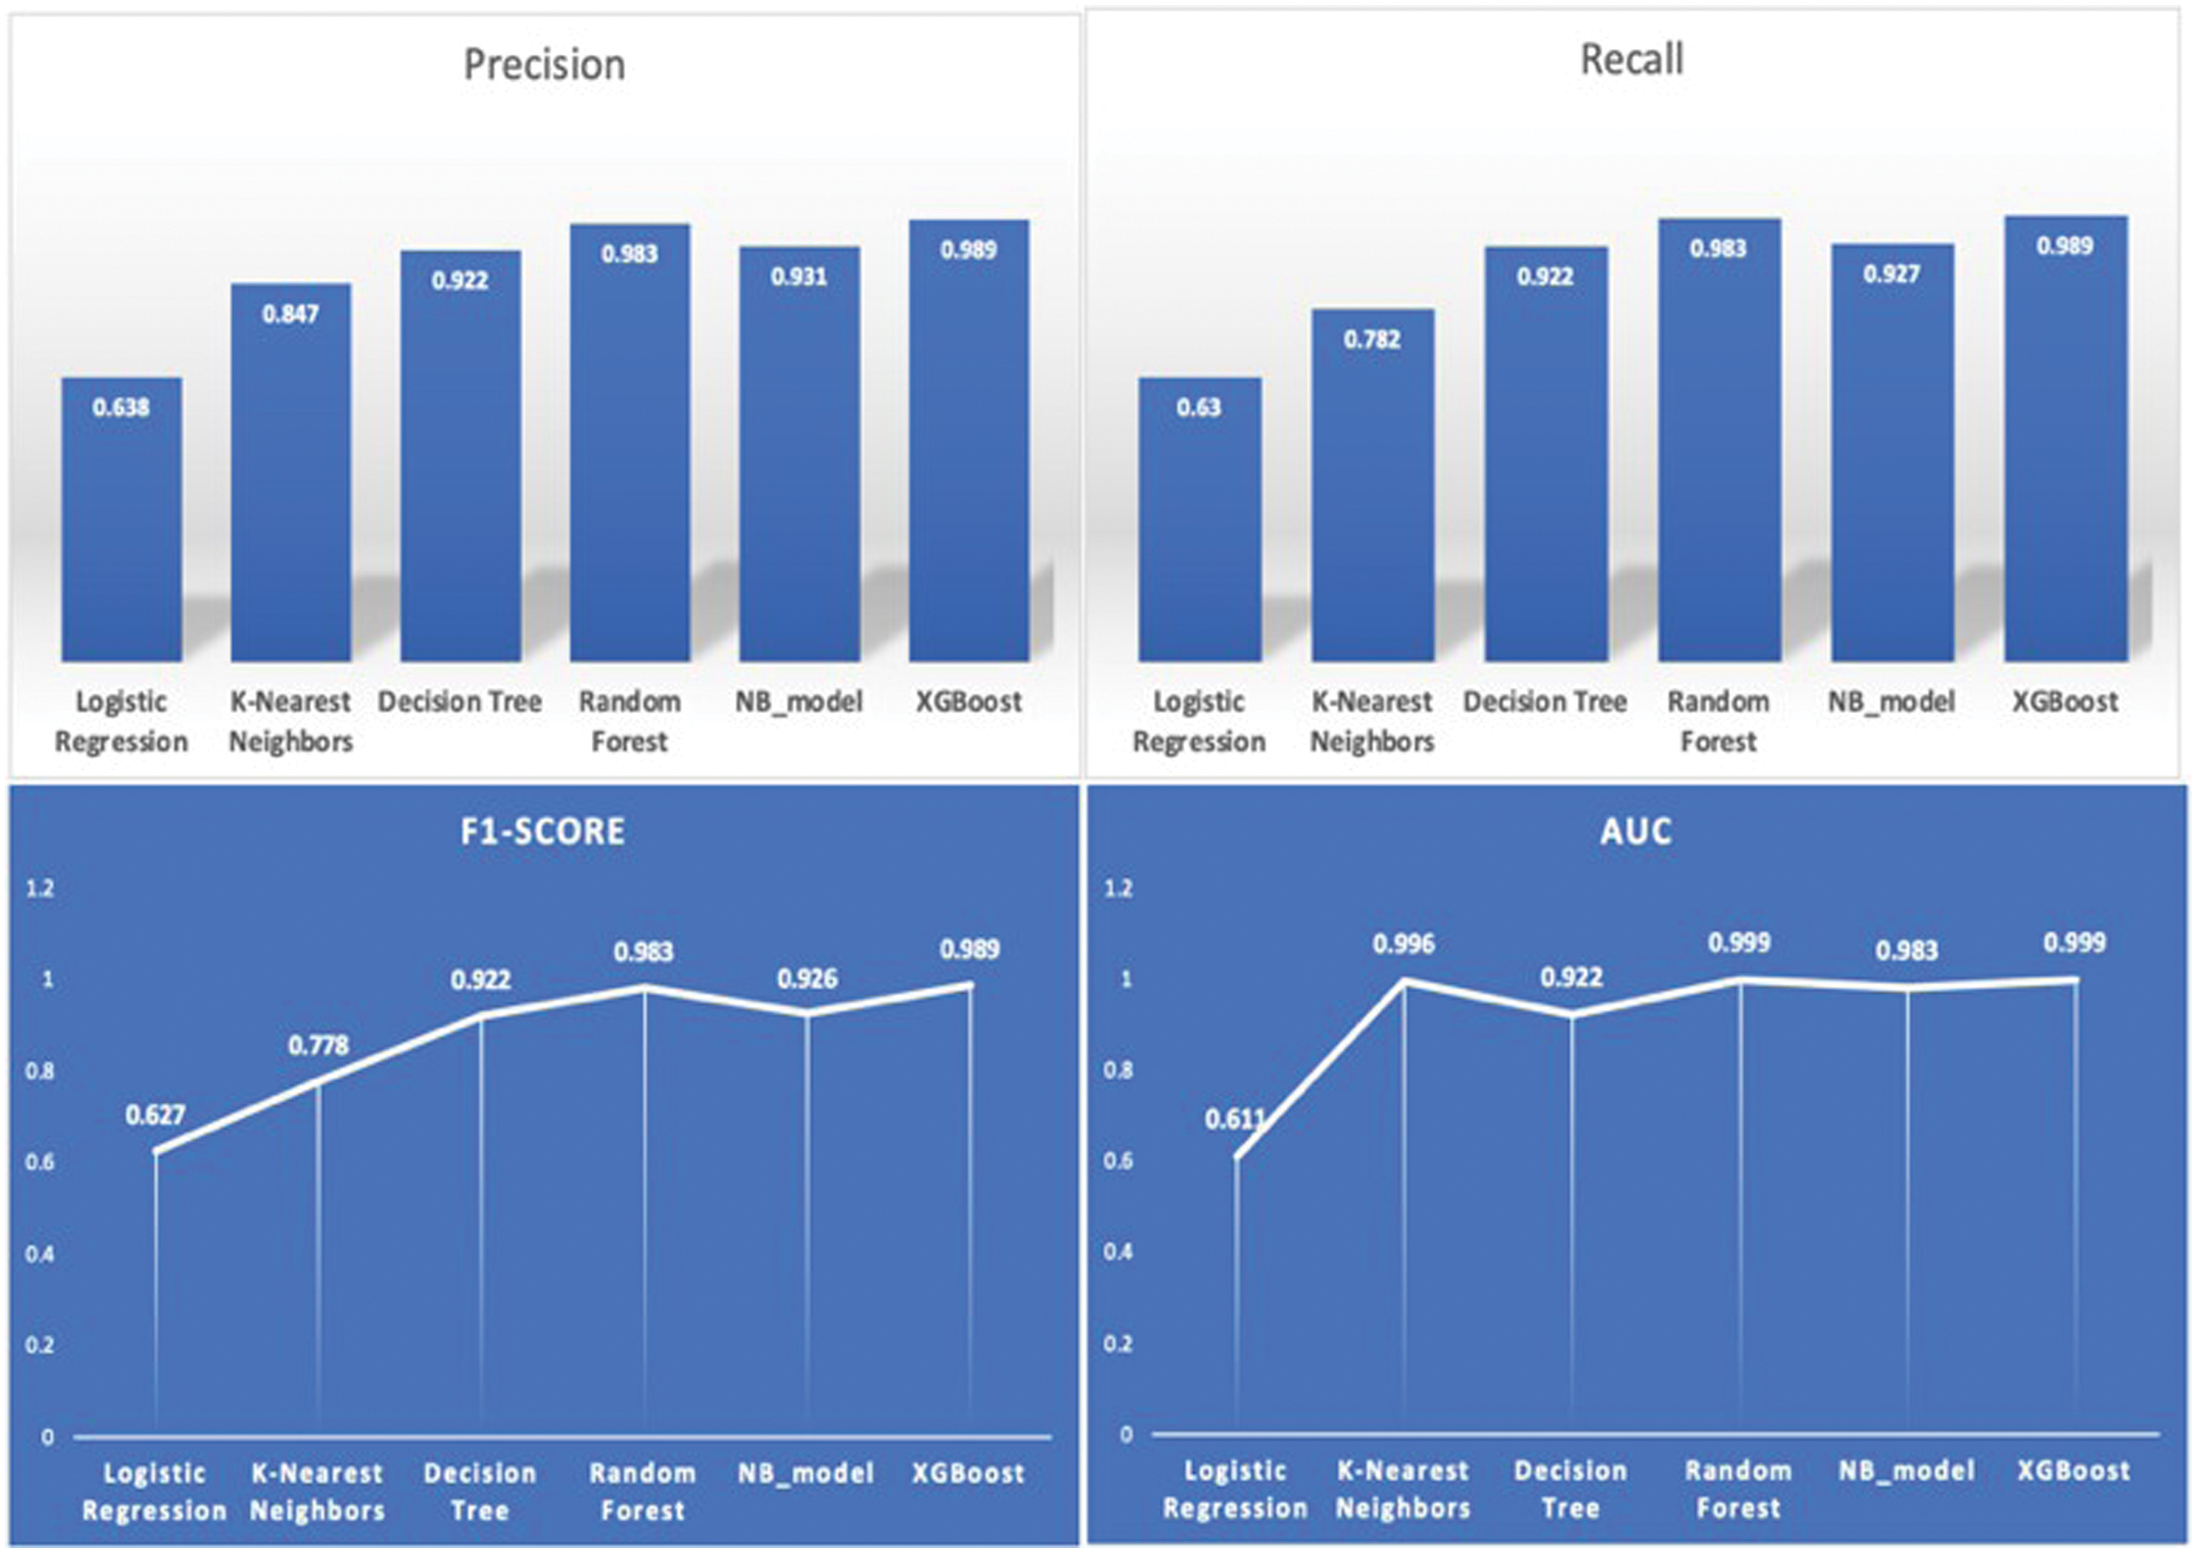 Fig. 7. Evaluation metrics across the models.
Figure 7 presents a detailed comparison of six ML models: Logistic Regression, KNN, DT, Random Forest, NB_model, and XGBoost. Metrics such as precision, recall, F1-score, and AUC are employed for this purpose. The evaluation of these metrics focuses on the model’s prediction capabilities, its ability to generalize, and its classification performance. The precision chart in the top-left corner indicates that XGBoost achieves the highest precision at 0.989, with Naïve Bayes following closely at 0.981 and Random Forest at 0.983. These three methods are more effective at minimizing false positives. Logistic Regression (0.638) exhibits the lowest precision and struggles to differentiate positive cases. The top-right recall chart illustrates the effectiveness of models in identifying positive cases. The highest recall achieved is 0.989 for XGBoost. Naïve Bayes (0.987) and Random Forest (0.987) are in close proximity in performance. KNN (0.782) and Logistic Regression (0.63) might have overlooked true positives because of their lower recall scores. The bottom-left chart shows that XGBoost achieves the highest F1-score of 0.989, reflecting its superior classification accuracy. Random Forest (0.983) and Naïve Bayes (0.986) demonstrate strong performance, whereas Logistic Regression (0.627) shows subpar results. Finally, the AUC chart (bottom right) illustrates the effectiveness of models in differentiating between items. XGBoost (0.999) and Random Forest (0.998) demonstrate exceptional class separation, achieving nearly perfect AUC scores. Logistic Regression (0.615) performs less effectively compared to DT (0.922) and KNN (0.896).
VI.RECOMMENDATION FOR FUTURE WORK
This study highlights the significant effectiveness of ML algorithms, particularly ensemble-based models, in classifying and predicting epileptic seizures using EEG data. In light of these findings, several recommendations can be made for subsequent investigations and practical applications in clinical settings. Initially, subsequent investigations ought to focus on the integration of DL architectures, such as CNNs, LSTM networks, and hybrid CNN–LSTM frameworks, to clarify complex temporal and spatial dependencies present in EEG signals. The accuracy of detection can be enhanced by these models, which are capable of handling nonlinear patterns that conventional ML algorithms may overlook. Exploring transfer learning and attention-based models could be beneficial for leveraging pretrained networks and identifying significant EEG features associated with seizures.
Additionally, it is essential to enhance the diversity of datasets. Future investigations should include larger, multi-center datasets that feature a wide variety of patients, seizure types, and recording conditions. This would enhance the model’s generalizability and robustness, allowing for reliable application across diverse clinical environments. Incorporating multi-modal data, such as Magnetic Resonance Imaging (MRI) scans or patient medical histories, has the potential to enhance predictive performance by providing additional contextual physiological information. Third, it is essential to focus on systems capable of predicting and detecting seizures in real time. Implementing ML models in wearable or embedded devices has the potential to enable continuous EEG monitoring, facilitating timely alerts for both patients and healthcare providers. This advancement would indicate a transition from looking back at past data to implementing proactive and preventive measures in healthcare.
Moreover, the adoption of XAI methodologies is crucial to ensure clinical interpretability and transparency. For healthcare professionals to have confidence in a model and for regulatory bodies to grant approval, it is crucial that they comprehend the rationale behind its classification of specific EEG patterns as indicative of epilepsy. Ultimately, incorporating ML frameworks into clinical decision support systems could assist neurologists in making early diagnoses and planning treatments by connecting research with practical application. In summary, upcoming studies should prioritize the integration of advanced DL techniques, enhance the diversity of datasets, boost interpretability, and achieve real-time, transparent, and patient-focused applications. These guidelines have the potential to significantly enhance the application of ML in neurological healthcare, paving the way for intelligent, automated, and tailored systems for the management of epilepsy.
While the proposed models achieved high predictive performance on the Epileptic Seizure Recognition dataset, direct comparisons with prior studies must be interpreted cautiously. Many published works use different preprocessing pipelines, data splits, evaluation protocols, and performance metrics, which may not be directly comparable. Therefore, rather than claiming superiority over all existing studies, this work positions its results within the context of controlled internal comparison under a unified experimental framework. All models were evaluated using identical preprocessing steps, consistent train–validation–test partitions, and matched evaluation metrics (accuracy, precision, recall, F1-score, and AUC). This ensures a fair comparative analysis within the scope of this study. Future work will involve benchmarking under standardized cross-study protocols to enable more rigorous external comparison.
VII.CONCLUSION
This investigation demonstrates that ML can effectively recognize and classify epileptic seizures through the analysis of EEG data. Ensemble-based algorithms, including Random Forest and XGBoost, demonstrated superior performance compared to other models evaluated (Logistic Regression, KNN, DT, and Naïve Bayes). Their performance metrics included optimal precision, recall, F1-score, and AUC. They exhibit strong learning capabilities, effectively adapt to complex nonlinear characteristics, and demonstrate resilience against overfitting, positioning them as highly suitable for clinical diagnostics. Additional investigations have indicated that ML is increasingly significant in the realm of healthcare diagnostics. Their work illustrates the capability of ensemble and hybrid methods in managing noisy, multidimensional biomedical data. This investigation demonstrates that ML models are capable of identifying subtle patterns in the UCI EEG dataset that may not be readily apparent through manual analysis. The results indicate that diagnostic systems utilizing ML can assist neurologists in making quicker and more informed decisions, thereby minimizing human error and enhancing patient outcomes. The investigation propels the applications of computational intelligence in medical signal processing forward. The findings indicate that Random Forest and XGBoost serve as dependable and interpretable models for detecting epileptic seizures. Their consistency and robustness provide a solid basis for advancing studies on real-time, scalable, and transparent clinical support tools aimed at enhancing the quality and efficiency of neurological care.