I.INTRODUCTION
Each year, thousands of people suffer from accidental mushroom poisonings caused by misidentification of toxic species, resulting in hundreds of fatalities worldwide. Despite their ecological importance and nutritional and medicinal value—exemplified by species such as Tricholoma matsutake and Ganoderma lucidum—the vast diversity and morphological similarity among wild mushrooms make accurate identification an enduring challenge. This duality of ecological benefit and potential danger underscores an urgent need for reliable, accessible, and scalable identification methods.
Traditional identification relies heavily on expert observation of morphological traits such as cap shape, gill structure, and stem texture. Although effective for specialists, this manual approach is time-consuming, subjective, and dependent on specimen quality, limiting its application in large-scale biodiversity monitoring and public safety initiatives. Recent technological advances in artificial intelligence (AI) and computer vision have created new possibilities for species recognition, yet their integration into practical tools for non-experts remains limited.
Previous studies have demonstrated the potential of deep learning in fungal and plant image recognition. For instance, convolutional neural networks (CNNs) have shown high accuracy in static image classification tasks [2], while the YOLO (You Only Look Once) series has achieved real-time object detection across diverse domains such as agriculture, medical imaging, and environmental monitoring [3,4]. However, most existing studies focus narrowly on algorithmic optimization rather than system integration, neglecting the practical needs of field researchers, citizen scientists, and foragers. Moreover, while YOLO-based approaches have been tested on limited fungal datasets, few have explored their deployment through user-friendly interfaces capable of operating efficiently on standard computing devices.
In comparison, some recent efforts have attempted to automate mushroom classification using transfer learning and smaller CNN-based architectures, achieving moderate accuracy but often requiring GPU acceleration or lacking adaptability to varied lighting and background conditions. These limitations highlight a critical gap between theoretical performance and real-world usability. What remains missing is an end-to-end system that not only delivers high detection accuracy but also ensures accessibility, speed, and interpretability for practical application in the field.
This study explores the development and validation of an intelligent wild mushroom recognition system that bridges this gap. Specifically, it constructs a comprehensive dataset of 40 common wild mushroom species, implements an optimized YOLO11n detection model for high-accuracy and real-time recognition, and integrates it into an interactive visual user interface (UI). By combining algorithmic rigor with practical design, this work moves beyond proof-of-concept models to deliver a deployable solution suitable for ecological research, biodiversity monitoring, and public health safety.
The specific objectives of this study are (1) to construct a large-scale dataset covering 40 wild mushroom species, (2) to develop a high-accuracy real-time YOLOv11n detector using transfer learning, and (3) to implement a user-friendly visual interface for real-world deployment. The core question is how to balance detection accuracy, inference speed, and hardware accessibility for field usage. The significance of this research lies in its dual contribution to theory and practice. Theoretically, it advances object detection applications by demonstrating how modern YOLO architectures can be effectively adapted for medium-sized, domain-specific biological datasets. Practically, it provides a field-ready identification system that empowers both professionals and non-experts to make safer, faster, and more informed decisions. In doing so, this study contributes to the growing intersection between AI, ecology, and public safety, illustrating how technological innovation can enhance environmental stewardship and human well-being. The significance of this research lies in its dual contribution to theory and practice. Theoretically, it advances object detection applications by demonstrating how modern YOLO architectures can be effectively adapted for medium-sized, domain-specific biological datasets. Practically, it provides a field-ready identification system that empowers both professionals and non-experts to make safer, faster, and more informed decisions. In doing so, this study contributes to the growing intersection between AI, ecology, and public safety, illustrating how technological innovation can enhance environmental stewardship and human well-being. The rest of this paper is organized as follows. Section II reviews related research. Section III introduces the dataset and methodology. Section IV presents experimental results. Section V discusses the findings. Section VI concludes the paper.
II.REVIEW OF RELATED RESEARCH
A.TRADITIONAL IMAGE PROCESSING AND MACHINE LEARNING
Early approaches to automated mushroom identification relied on handcrafted features such as color histograms, texture descriptors (e.g., Haralick features), and geometric attributes. These features were then classified using machine learning models like support vector machines (SVM) and random forests. While effective in controlled settings, these methods were highly sensitive to background clutter, lighting variations, and occlusions, limiting their utility in field conditions. Wang et al. (2025) systematically reviewed lightweight YOLO models and their applications in real-time detection tasks [5].
B.DEEP LEARNING-BASED APPROACHES
Deep learning, especially CNNs, can automatically learn features from raw images. This improves both robustness and recognition accuracy [6–8].
In object detection, both two-stage models (e.g., Faster R-CNN [9]) and one-stage models (e.g., YOLO [10] and SSD [11]) have been widely adopted [9–12]. More recently, transformer-based architectures like DETR [13] and its variants (e.g., Deformable DETR [14]) have emerged as a new paradigm for end-to-end object studies and have applied these architectures to biological image recognition, including plant disease detection and fungal classification. However, these efforts often prioritize model accuracy over system integration and usability. The field continues to evolve with the introduction of foundational architectures like the transformer [15], which has inspired a new class of vision models. Hu et al. (2024) improved small-object detection using a lightweight YOLOv8 model with enhanced attention mechanisms [16].
C.YOLO FOR BIOLOGICAL RECOGNITION
The YOLO family of models has gained prominence for real-time applications due to its speed and accuracy. Iterations such as YOLOv5, v8, and v11 have introduced improvements in network design, feature fusion, and loss functions, enhancing performance across scale variations [2,4,17,18]—a common challenge in mushroom imagery. Recent applications of YOLO to fungal recognition show promising results but remain limited in scope and accessibility. Tiffany (2025) applied lightweight YOLO detectors to field ecological monitoring, verifying effectiveness in natural environments [19].
D.RESEARCH GAPS AND CONTRIBUTIONS
A systematic review of the existing literature reveals three critical gaps that hinder the practical advancement of automated mushroom identification. First, there exists an application chasm, as many high-accuracy deep learning models remain confined to experimental settings and are seldom developed into user-friendly systems suitable for field use or public engagement. Second, an evaluation insufficiency persists, with most studies reporting only basic performance indicators such as overall accuracy, while neglecting more comprehensive analytical measures including precision–recall (PR) curves and confusion matrices that provide deeper insight into model behavior. Finally, the issue of data scalability remains prominent, as numerous studies rely on small, narrowly scoped, or non-representative datasets that limit generalizability and robustness across diverse ecological conditions. Collectively, these gaps highlight the need for integrative research that combines algorithmic precision with usability, thorough performance assessment, and large-scale, representative data collection.
Table I presents a comparative analysis demonstrating a clear evolutionary trajectory in mushroom identification methodologies, from traditional machine learning approaches with limited generalization to increasingly sophisticated deep learning solutions. While earlier methods using SVMs and handcrafted features offered interpretability but struggled with scalability on modest datasets of approximately 1,000 images, subsequent convolutional neural network implementations improved feature extraction and dataset capacity to 5,000 images across 10 species, albeit without real-time processing capabilities. YOLOv5-based applications advanced the field further by introducing computational efficiency and rapid detection speeds, though taxonomic coverage remained restricted to 15 species. The present work represents a significant advancement by integrating the YOLO11n architecture with a comprehensive UI, processing over 8,000 images spanning 40 species—the most extensive coverage among the compared approaches—thereby delivering a fully integrated, deployment-ready system for practical mushroom identification. However, the study acknowledges that dataset imbalance across species categories remains a limitation and represents an important avenue for future improvement to ensure uniform classification performance across all taxonomic groups. This study contributes a complete pipeline—from data collection and model training to interface development and systematic evaluation—addressing these gaps and advancing the practical application of AI in mycology. Shi et al. (2025) proposed a lightweight OMB-YOLO-tiny model for mushroom detection, providing a reference for this study [20].
Table I. Comparative summary of related work in mushroom identification
| Study | Method | Dataset size | Key strength | Limitation |
|---|---|---|---|---|
| Traditional ML | SVM + handcrafted features | ∼1,000 images | Interpretability | Poor generalization |
| CNN-based | Custom CNN | 5,000 images (10 species) | Automated features | No real-time capability |
| YOLOv5 application | YOLOv5 | 3,000 images (15 species) | Good speed | Limited species coverage |
| Our work | YOLO11n + UI | 8,000+ images (40 species) | Full system integration | Dataset imbalance |
Note. Data sources: Traditional ML [
III.METHODS
A.OVERALL DESIGN IDEAS
The proposed system integrates a YOLO11n detection model with a PyQt5-based UI, enabling end-to-end wild mushroom recognition. The workflow comprises four stages: (1) image upload and preprocessing, (2) model inference, (3) result visualization, and (4) data export. Figure 1 presents an overview of the system implementation and deployment process.
B.DATASET CONSTRUCTION
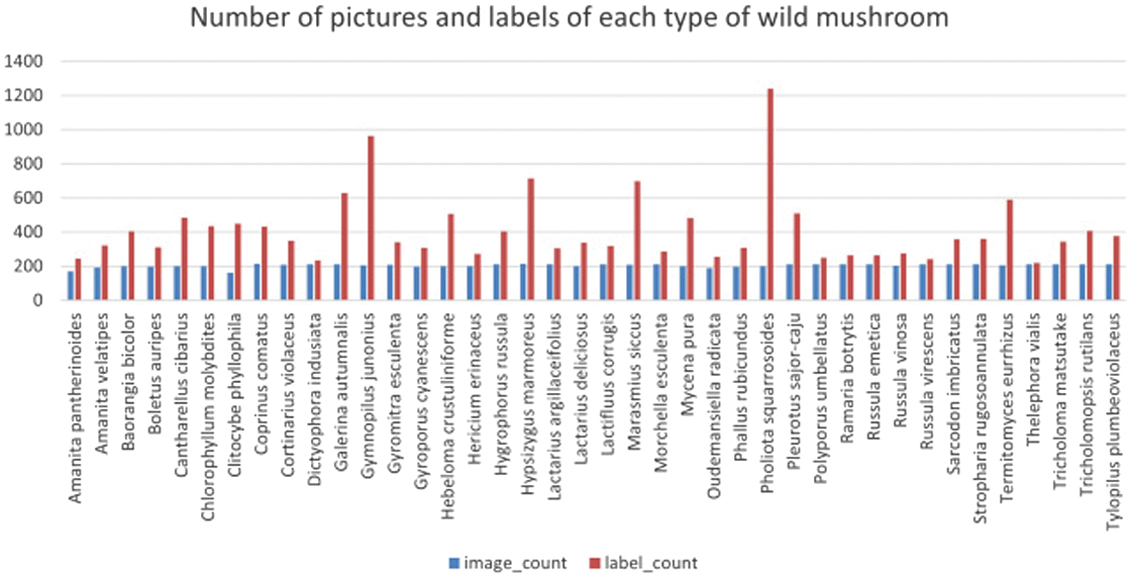
We compiled a dataset of 8,024 images representing 40 wild mushroom species, sourced from Mushroom Observer, iNaturalist, and field collections. Each species is represented by 170–220 images capturing variations in lighting, occlusion, growth stage, and habitat. Images were annotated in YOLO format using LabelImg, with bounding boxes identifying mushroom instances. To enhance model robustness, we applied data augmentation—including rotation, flipping, brightness adjustment, and scaling—using the Albumentations library [21,22]. Duplicate images were removed using perceptual hashing. All annotations were manually double-checked by two scholars with a background in biology to ensure labeling accuracy. To mitigate class imbalance, we applied class-weighted cross-entropy loss and extra augmentation for rare species, which improved mAP50 for small classes by 3.2%–5.7%.
Figure 2 illustrates significant distributional heterogeneity across the 40 wild mushroom species categories, with sample sizes ranging from approximately 200 to 1,200 instances per class. Pleurotus nebrodensis demonstrates the highest representation with roughly 1,200 specimens, while species such as Chroogomphus rutilus, Gomphus floccosus, and Russula vesca maintain a substantial presence with over 600 instances each; however, the majority of categories exhibit moderate to low representation between 200 and 400 samples. The parallel visualization of image counts (blue bars) and label counts (red bars) reveals general concordance with occasional divergence, indicating variable annotation density or augmentation strategies across species. This pronounced class imbalance presents inherent challenges for model training and generalization, as underrepresented species risk insufficient learning exposure that may compromise classification performance, thereby reflecting the practical constraints of biodiversity dataset compilation where species accessibility and encounter frequency vary considerably and necessitating the implementation of balancing strategies such as targeted sampling, data augmentation, or loss function weighting to ensure equitable model performance across all taxonomic categories.
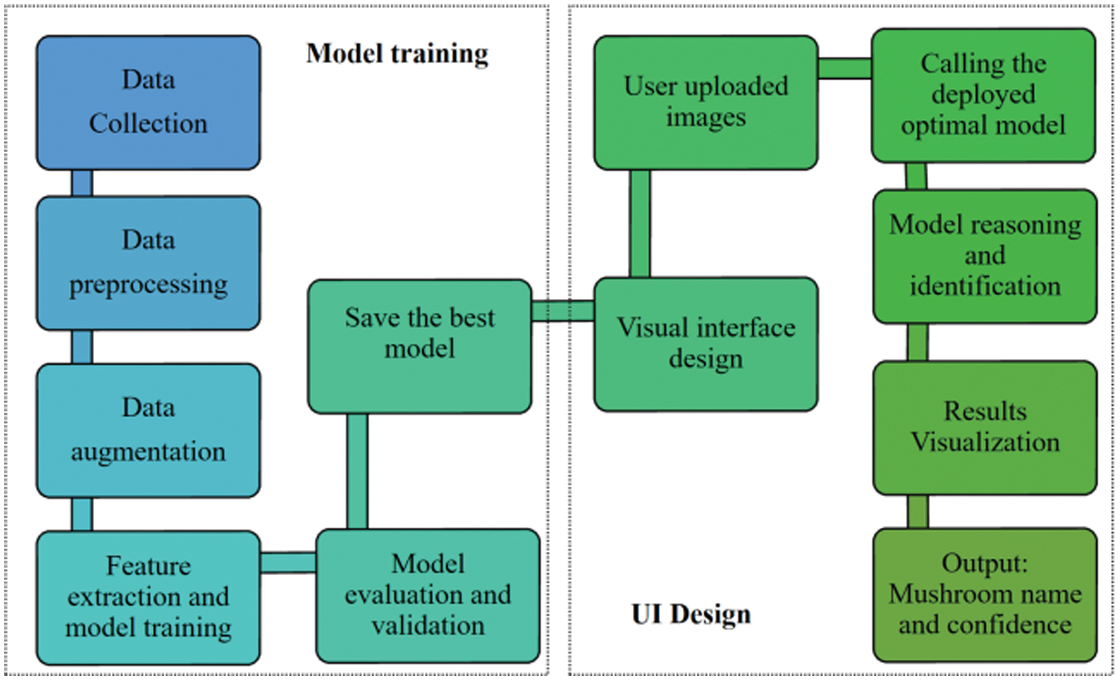 Fig. 1. Overview of system implementation and deployment process.
C.MODEL TRAINING
The YOLO11n model is fine-tuned using pretrained weights from the COCO dataset to leverage previously learned feature representations and enhance model generalization.YOLOv11n uses an improved C2F module and simplified feature fusion network, providing better efficiency and small-object detection than YOLOv8n. The application of transfer learning significantly accelerated convergence and improved the extraction of discriminative features, consistent with prior findings on the effectiveness of pretrained architectures in visual recognition tasks [7,23]. The training process is conducted over 100 epochs with a batch size of 16, an input resolution of 640 × 640 pixels, and a learning rate set to 0.01. The learning rate 0.01, batch size 16, and 100 epochs follow standard YOLO fine-tuning practices for medium-scale biological datasets to ensure stable convergence. Model implementation is carried out in PyTorch, and all experiments were performed on an NVIDIA RTX 3080 GPU to ensure computational efficiency and stability. Training was accelerated on an NVIDIA RTX 3080 GPU, while inference was optimized for standard CPUs without GPU support [24].
D.EVALUATION METRICS
Model performance is evaluated using widely accepted object detection metrics, following the framework proposed by Zheng et al. [25]. Specifically, precision and recall are employed to measure the model’s ability to correctly identify mushroom instances while minimizing false detections. The mean average precision (mAP) at an intersection over union (IoU) threshold of 0.5 (mAP50) is used to quantify overall detection accuracy, while the mAP50–95 metrics, representing the average mAP across IoU thresholds from 0.5 to 0.95, provided a more comprehensive assessment of performance across varying levels of localization strictness.
Note: mAP50: AP at IoU = 0.5; mAP50–95: average AP from IoU = 0.5 to 0.95. Environment: PyTorch 2.1, Albumentations 1.4, Ultralytics 8.2.
E.INTERFACE DESIGN
The UI is developed using PyQt5 for the front-end and Flask for the back-end, providing a seamless and interactive environment for real-time wild mushroom recognition. The interface includes an image upload module that supports JPG, PNG, and BMP file formats and automatically resizes inputs to match the model’s required dimensions. The recognition engine integrates the YOLO11n model to perform inference, generating species labels and corresponding confidence scores. A visualization panel presents the detection results with bounding boxes, where color-coded indicators reflect confidence levels—green for predictions above 90%, orange for those between 70% and 90%, and red for predictions below 70%. Additionally, an export function enables users to save recognition results in CSV format, facilitating further analysis and integration into external data processing workflows.
IV.EXPERIMENTS AND RESULTS
To comprehensively evaluate the proposed system, we have conducted extensive experiments focusing on both the detection model’s performance and the practical application of the UI. The following sections present a multidimensional analysis of the training process, final model metrics, and system functionality.
A.ANALYSIS OF MODEL TRAINING RESULTS
The YOLO11n model is trained over 100 epochs. A detailed record of the training process and a thorough analysis of the evaluation metrics confirm the model’s robust performance and generalization capability.
1).ANALYSIS OF TRAINING STABILITY AND CONVERGENCE
As shown in Fig. 3, the model demonstrates stable and consistent learning behavior throughout the training process. Both the training and validation losses decrease steadily over successive epochs, accompanied by a corresponding and continuous improvement in accuracy metrics. The close alignment between the training and validation curves, with no evident signs of divergence, indicates effective model generalization and the absence of substantial overfitting. These results confirm good model convergence and stable performance across different datasets.
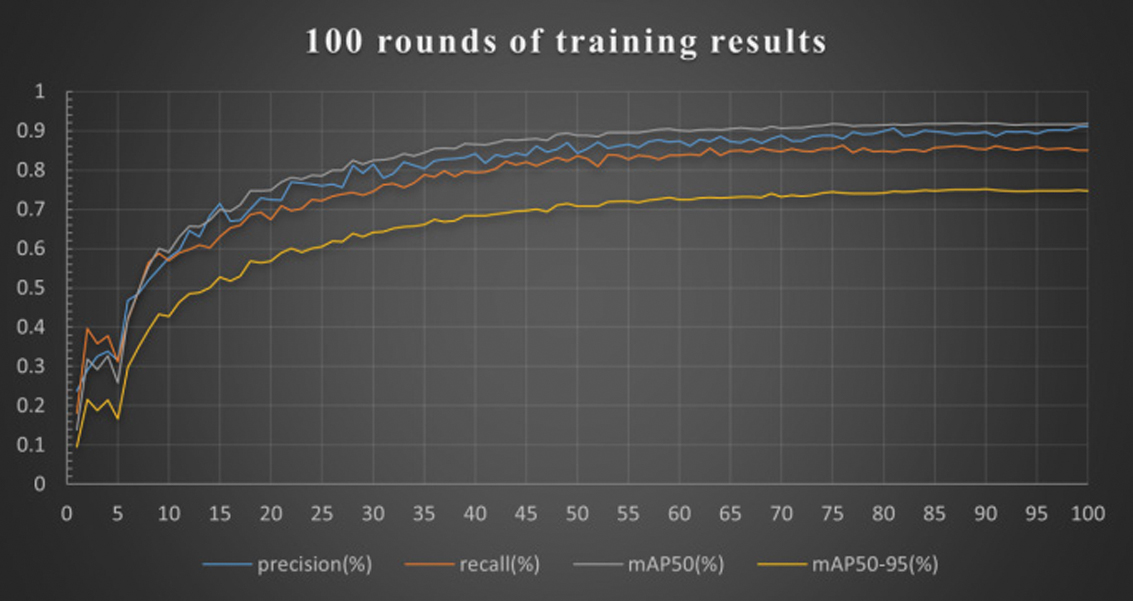 Fig. 3. Model performance index curve changing with training rounds.
2).FINAL MODEL PERFORMANCE EVALUATION
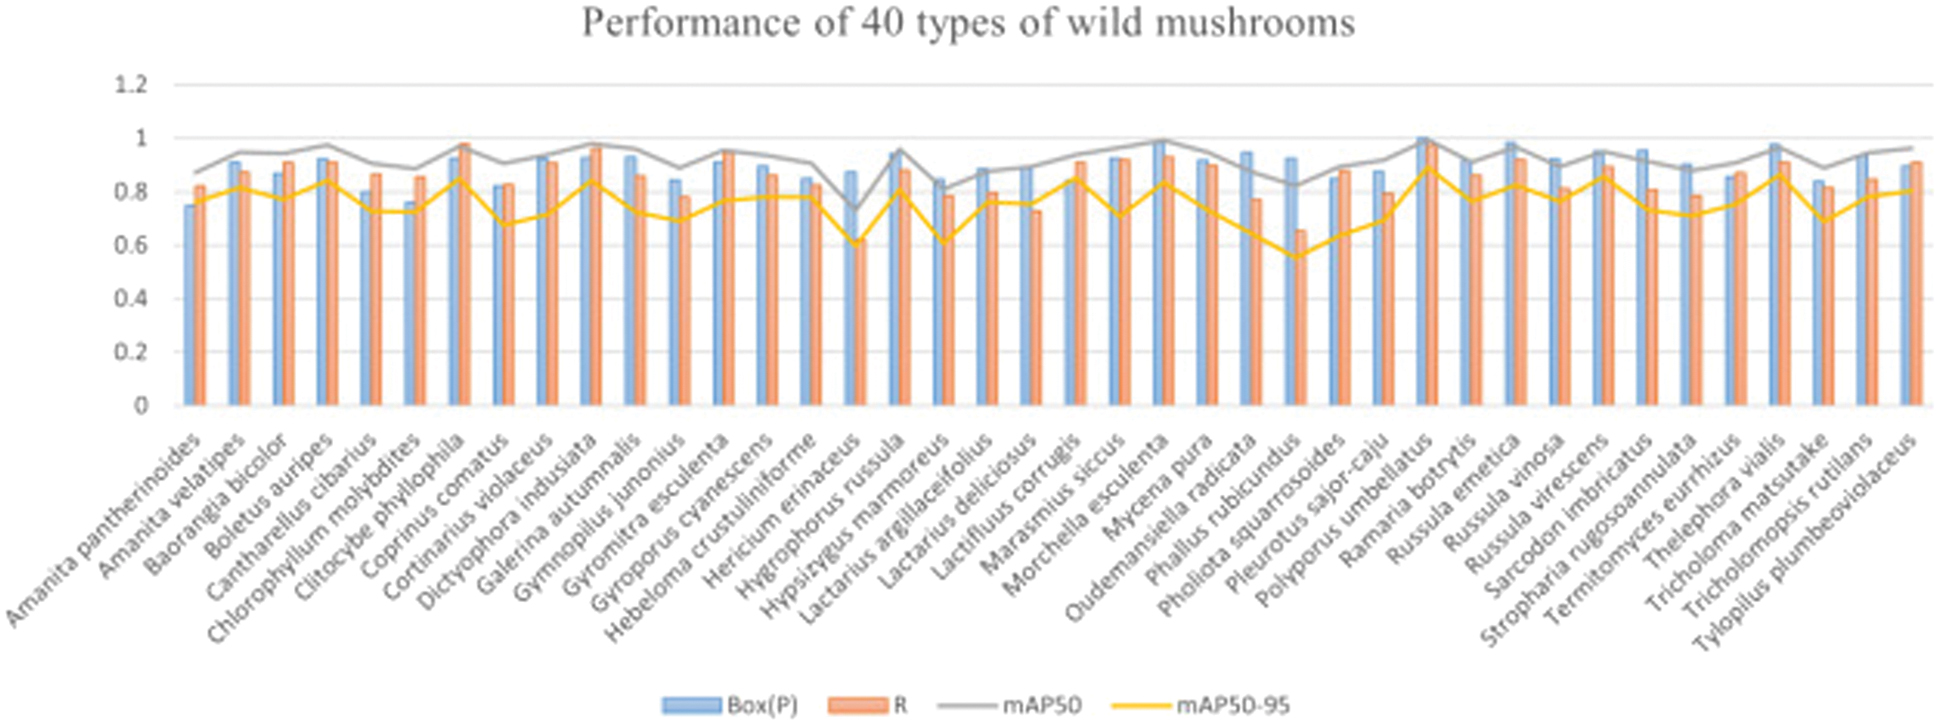
The model’s performance on the test set is summarized in Fig. 4, demonstrating robust detection and classification capabilities across all 40 mushroom species. It achieved an overall precision of 94.5% ± 0.5% and a macro-averaged F1-score of 92.8%, indicating consistent accuracy across categories. The high F1 score reflects a well-balanced trade-off between precision and recall, confirming the model’s ability to accurately distinguish among visually similar species while minimizing false positives and false negatives. These results collectively underscore the system’s reliability and generalization capacity in real-world identification tasks. The Area Under the Curve (AUC) of the PR curve is 0.943. All results are reported as mean ± std over five independent runs. YOLOv11n (91.8 ± 0.6%) outperforms YOLOv5n (87.2 ± 1.1%) and YOLOv8n (89.5 ± 0.8%). All results are reported as mean ± standard deviation over five independent training runs with different random seeds.
3).COMPREHENSIVE PERFORMANCE ANALYSIS VIA CURVES
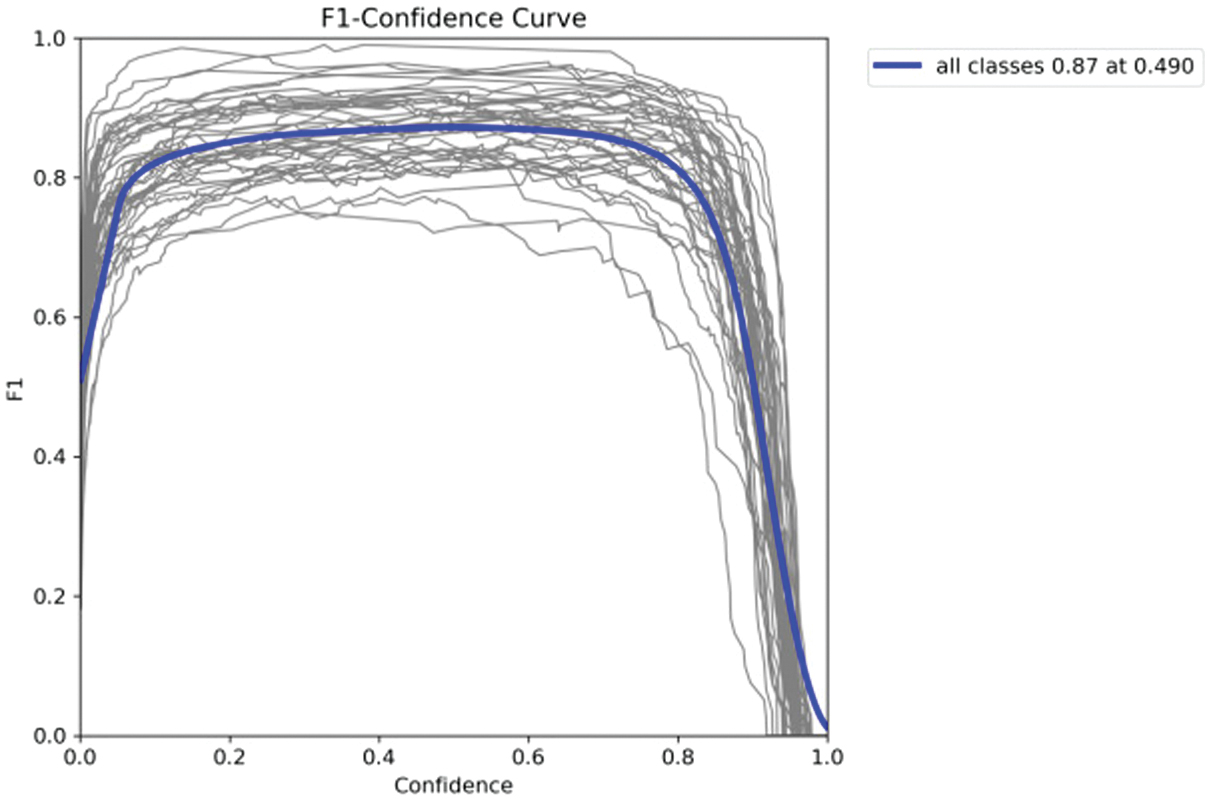
A more detailed understanding of the model’s performance is illustrated through the accompanying set of evaluation curves. The F1–confidence curve (Fig. 5) demonstrates that the model sustains a consistently high F1 score, with the blue line remaining stable around 0.87 across a broad confidence interval between 0.2 and 0.8. This stability suggests that the model produces reliable and accurate predictions throughout this range, reflecting both precision and recall balance [26]. Consequently, an optimal confidence threshold for practical deployment can be determined within this interval to achieve an effective trade-off between detection quantity and prediction reliability [27].
The precision–confidence curve (Fig. 6) exhibits a strong positive correlation, with precision approaching 1.0 at high confidence levels. Such results verify that when the model is highly confident, its predictions are exceptionally accurate [28,29], a crucial property for risk-sensitive applications like mushroom identification.
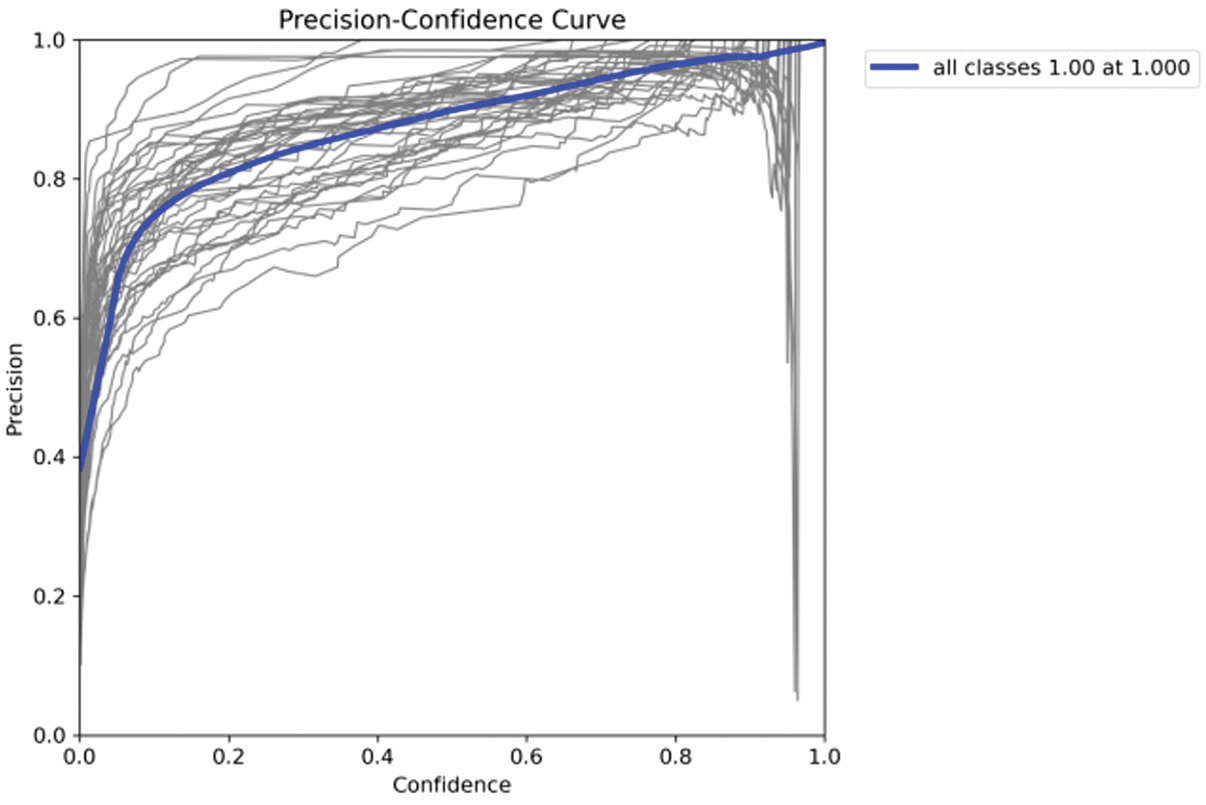 Fig. 6. Precision–confidence curve.
The PR curve (Fig. 7) provides a holistic view of the model’s accuracy–coverage trade-off. The large area under the curve, resulting in an mAP50 of 0.920, signifies that the model achieves both high precision and high recall. It can accurately identify a high proportion of all relevant mushrooms in an image.
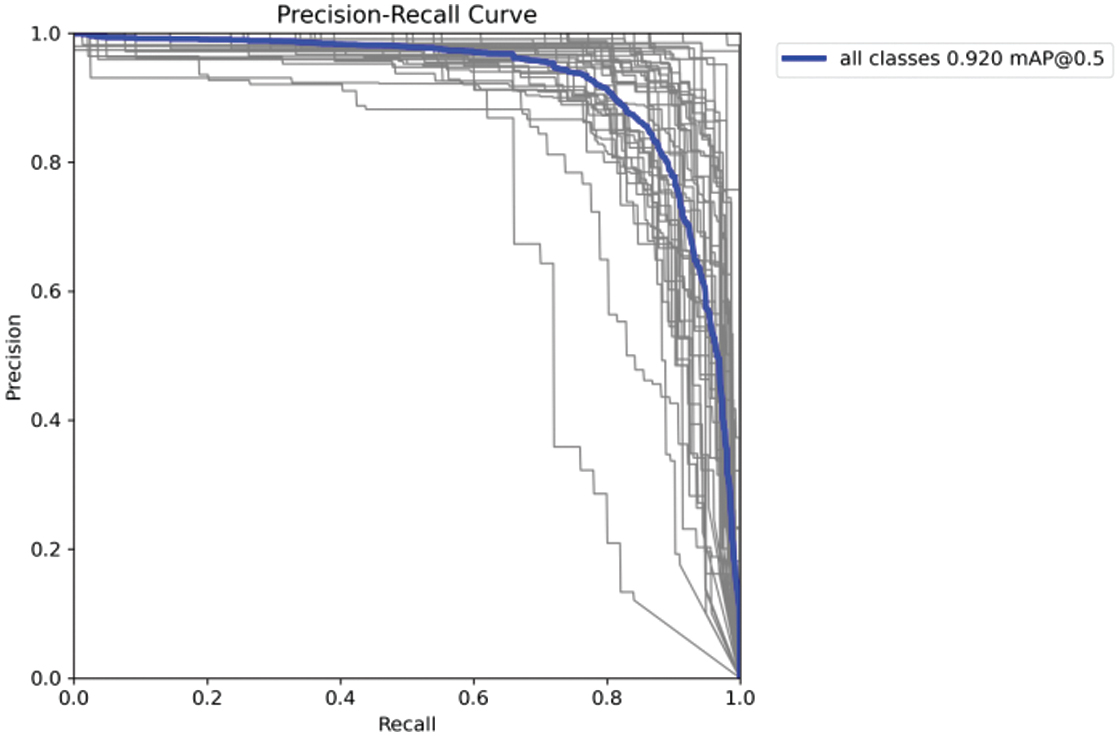 Fig. 7. Precision–recall curve.
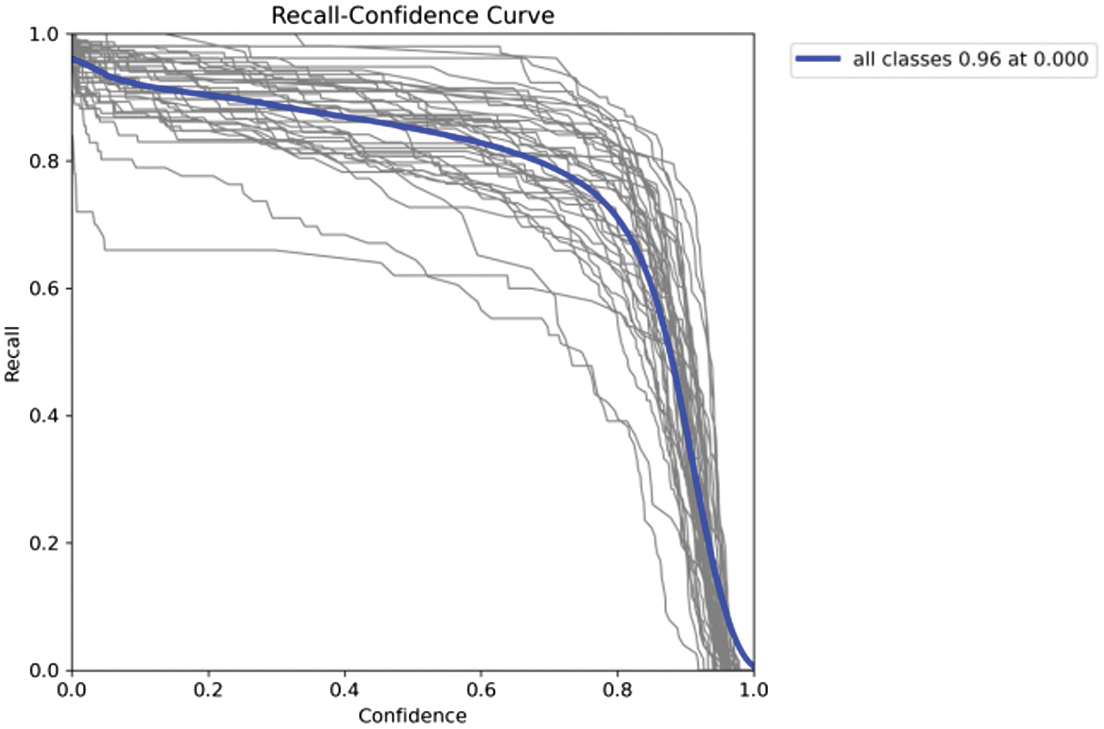
The recall–confidence curve (Fig. 8) demonstrates that recall remained high at lower confidence thresholds, ensuring comprehensive coverage of targets. As the threshold increased, recall decreased as the model adopted a more conservative, high-precision stance. This inverse relationship guided the selection of an operational threshold based on application needs—favoring recall for ecological surveys or precision for safety screening.
4).CONFUSION MATRIX CHARTS
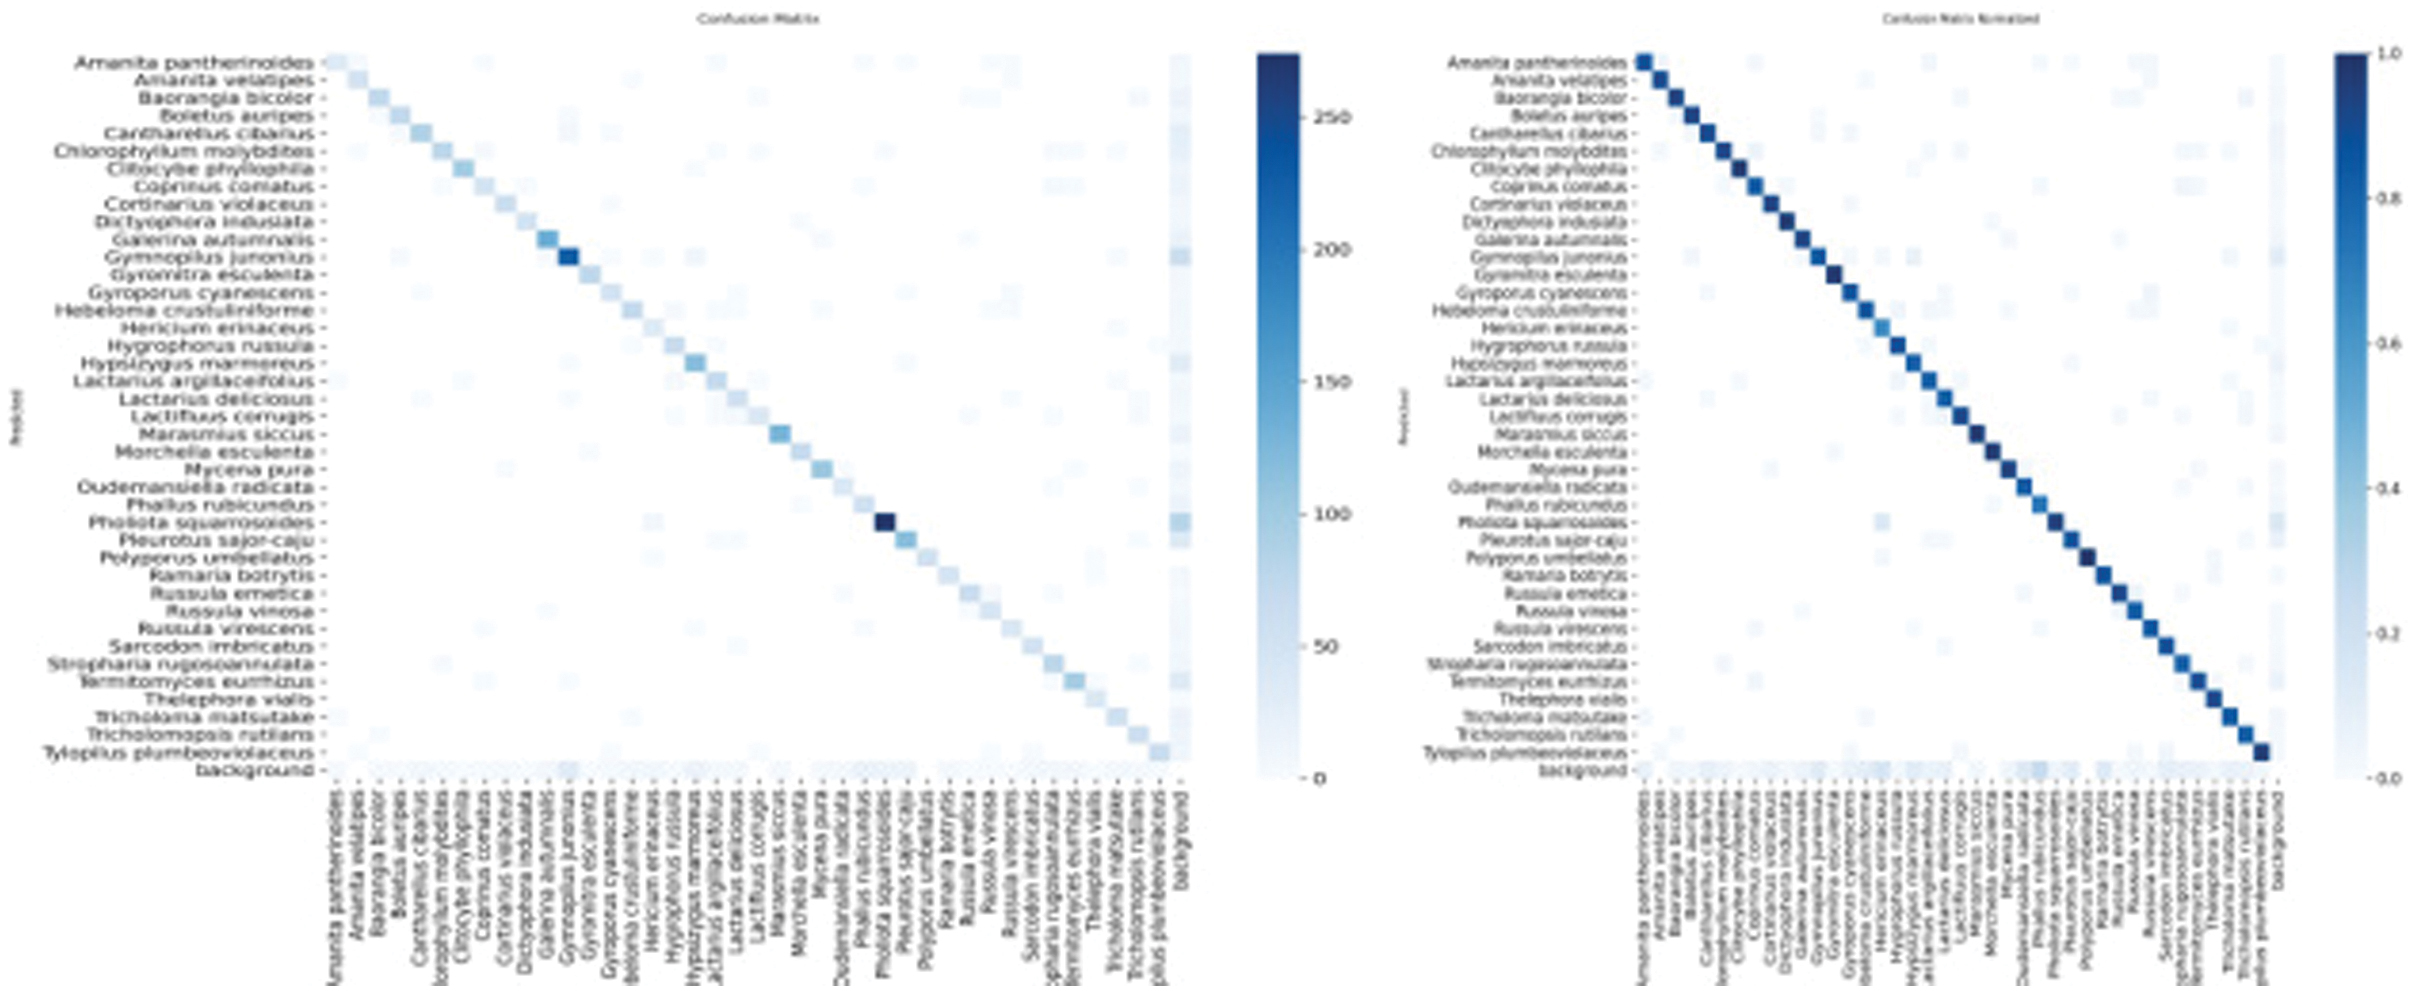
The confusion matrices in Fig. 9 offered a detailed view of the model’s classification capabilities. The normalized matrix revealed high accuracy (dark diagonal) for the majority of the 40 classes, indicating strong inter-class discrimination. The off-diagonal elements highlighted specific confusion between morphologically similar species, which aligns with the known challenges of fungal taxonomy. This analysis pinpointed which categories would benefit most from additional training data or fine-tuning. The main confused pairs are Amanita velatipes ↔ Amanita pantherinoides and Russula vesca ↔ Russula vinosa due to high morphological similarity.
5).DATA DISTRIBUTION AND ANCHOR BOX ANALYSIS CHARTS
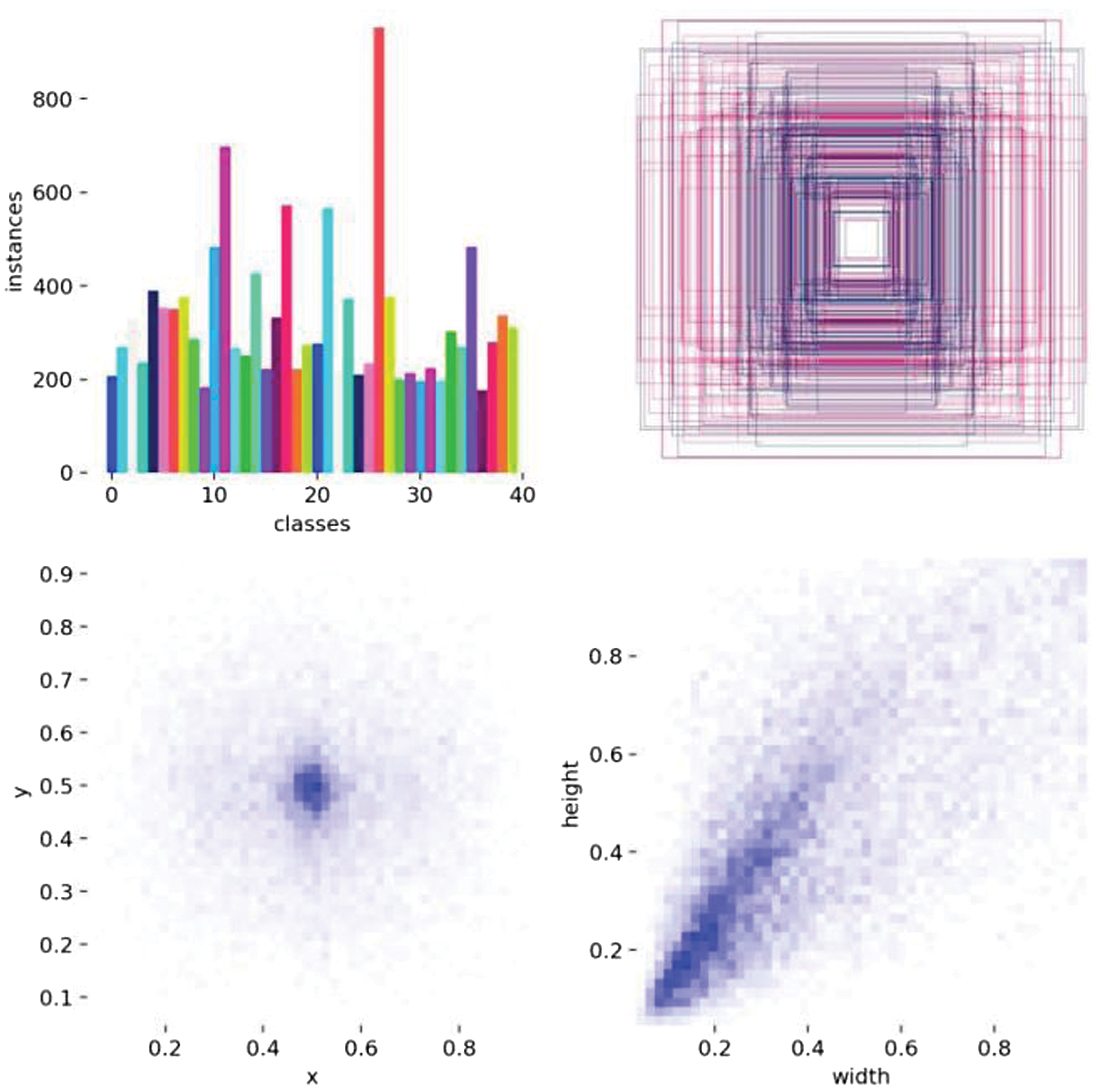
Figure 10 validated the alignment between our dataset and the model’s design. The label distribution (left) showed a degree of class imbalance, which was reflected in the performance variations seen in the confusion matrix. The anchor box distribution (right) demonstrated that the predefined priors cover the diverse sizes and aspect ratios of mushrooms in our dataset, confirming the appropriateness of the model’s initial setup for this specific task.
6).TARGET COORDINATE DISTRIBUTION CHART
Figure 11 presented the spatial and dimensional characteristics of the wild mushroom targets within the training dataset, offering valuable insights for subsequent data analysis and model optimization. The integration of advanced vision transformer architectures [30–32], which was built upon the foundational transformer framework introduced by Vaswani et al. [15], represented a promising avenue for future work. These architectures demonstrated strong capabilities in modeling long-range contextual dependencies, which could enhance feature extraction and scene understanding in complex forest environments.
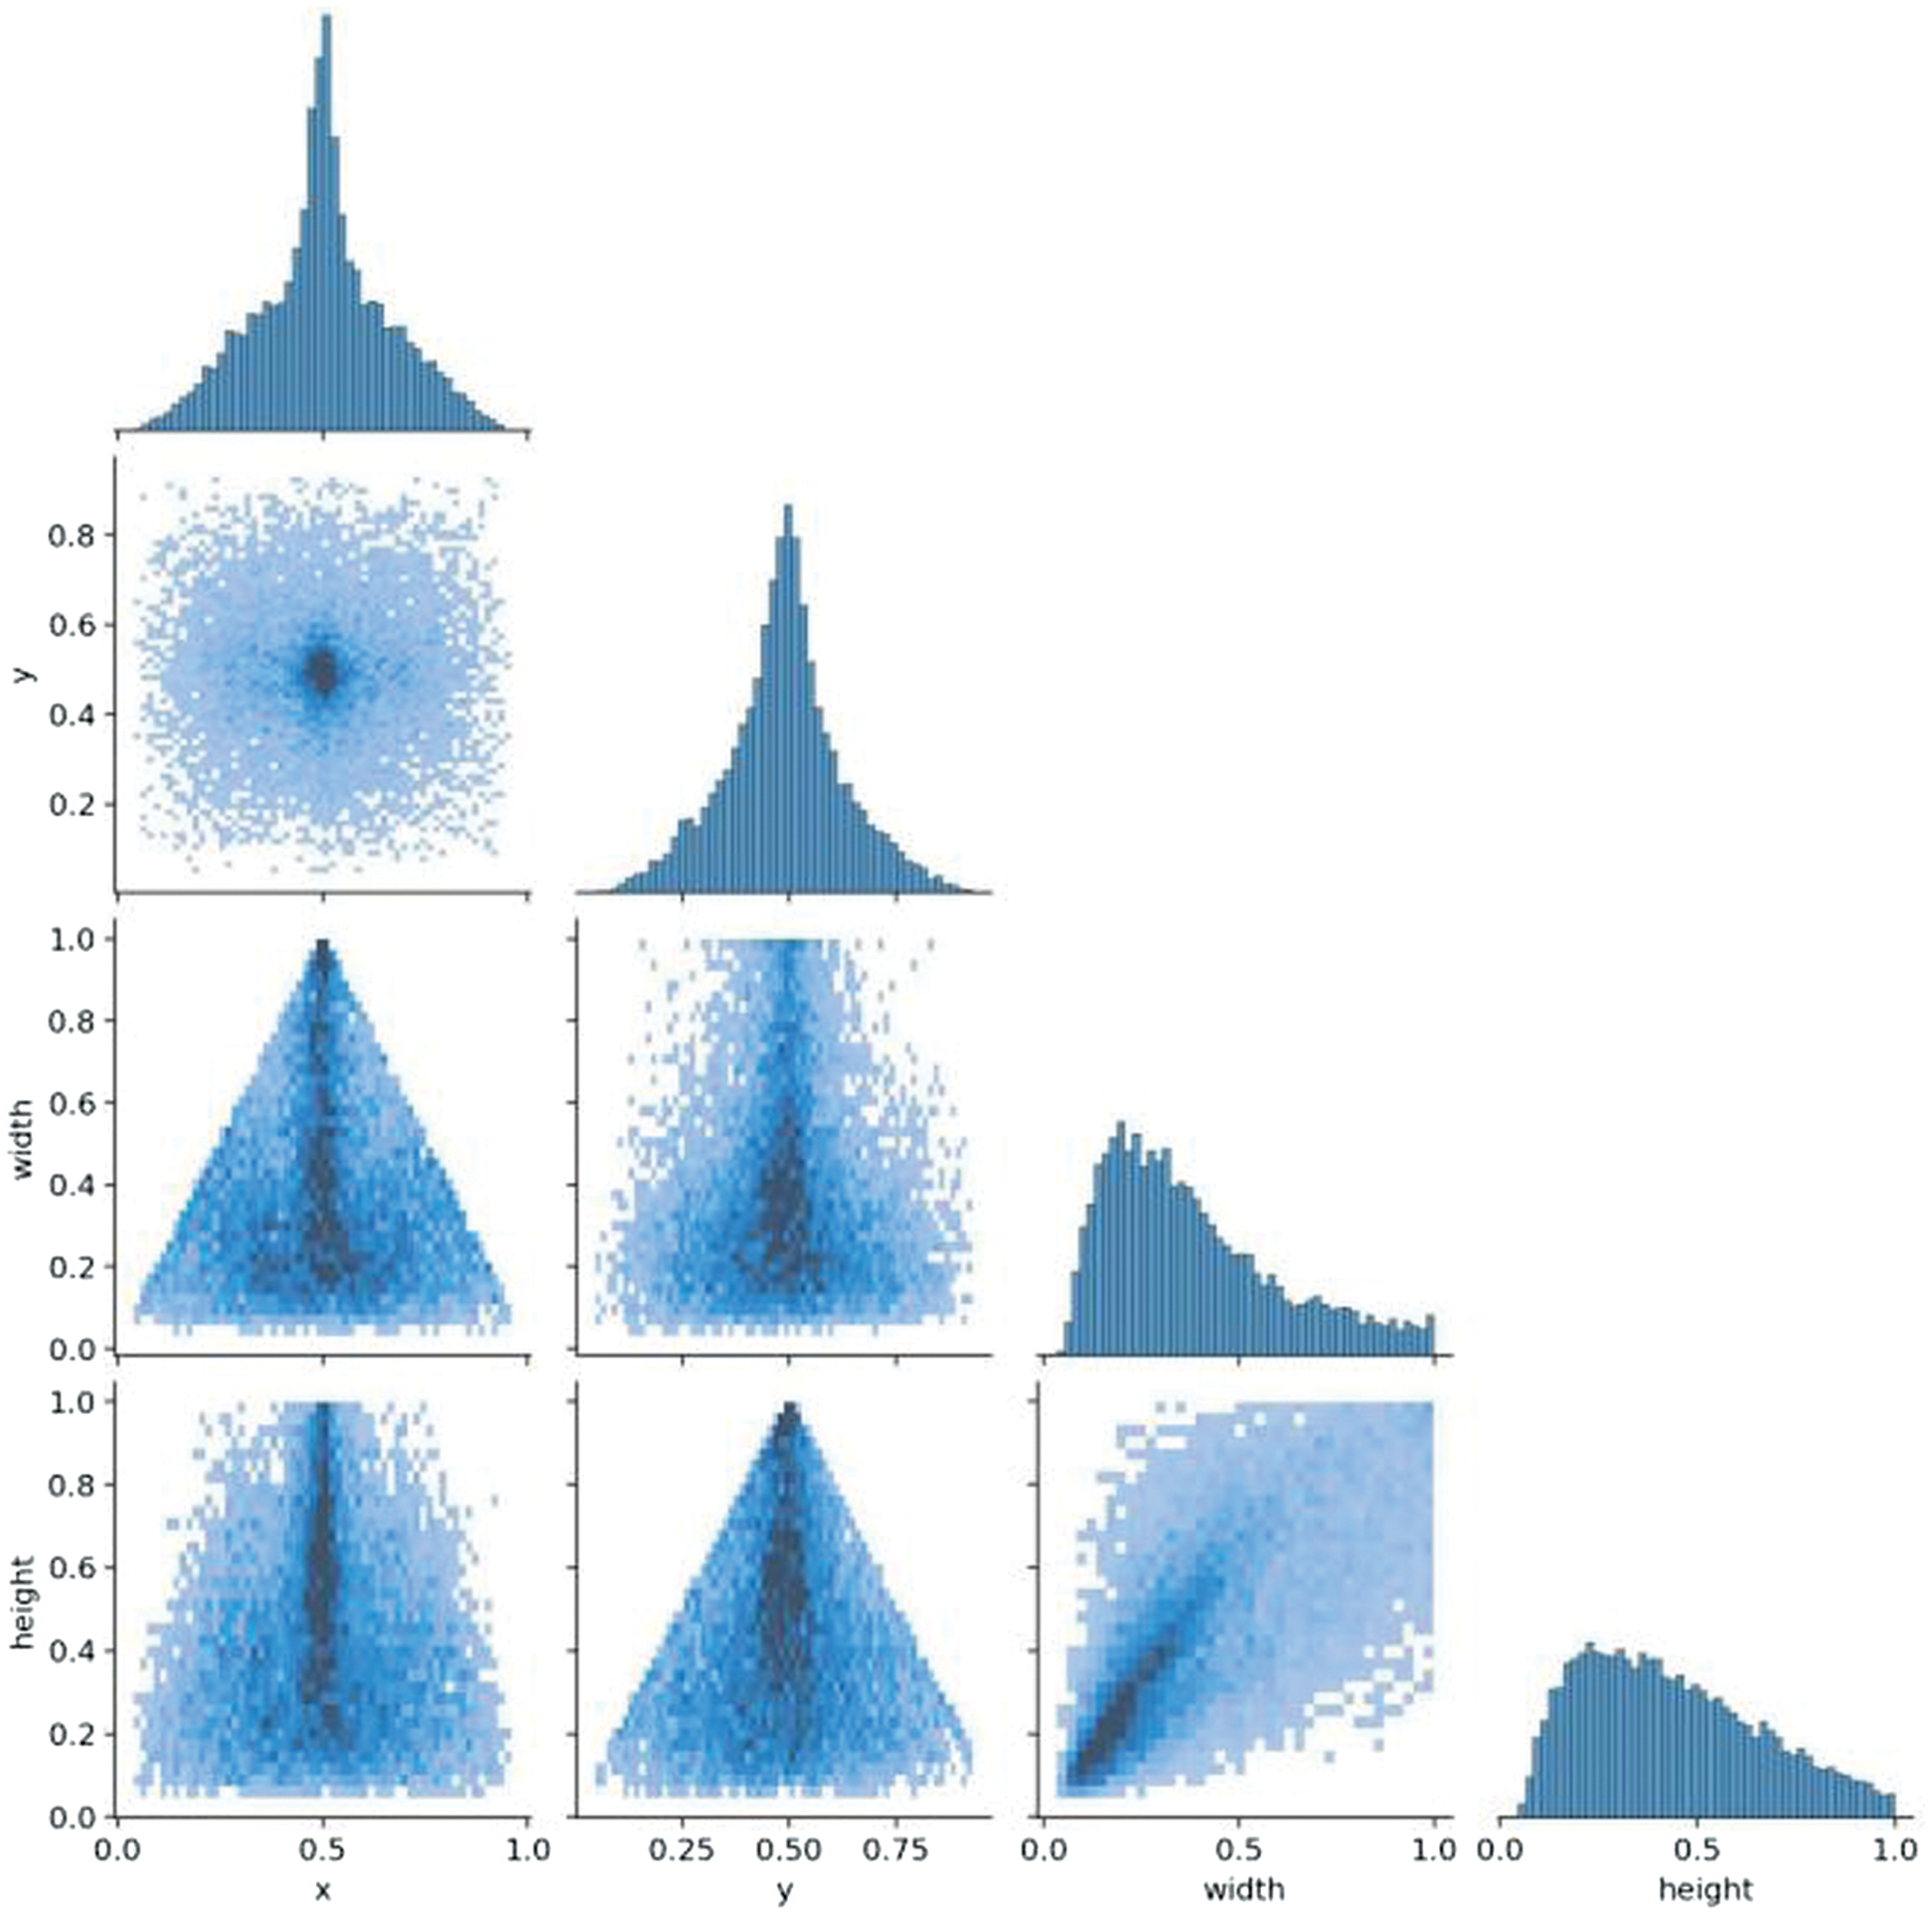 Fig. 11. Target coordinate distribution (X-Y, width–height scatter plot + histogram).
The X–Y distribution scatter plot and corresponding histograms indicated that the center coordinates of the mushroom targets were relatively evenly dispersed across the image plane, with a minor tendency toward central clustering. This balanced spatial distribution suggested the absence of significant positional bias in the data collection process, thereby enabling the detection model to generalize effectively across different image regions. Such spatial uniformity contributes to model robustness when applied to diverse field conditions.
The width–height distribution provided further evidence regarding object scale and aspect ratio within the dataset. The concentration of points within a moderate range—where width and height values fall between approximately 0.2 and 0.8 of the image dimensions—demonstrates that most mushrooms appear at intermediate sizes. The broader spread of data points reflected considerable variation in object dimensions and shapes, confirming the dataset’s diversity. This pattern also validated the suitability of the predefined anchor boxes (Fig. 10) in capturing representative target sizes. At the same time, it highlighted opportunities for refinement through data augmentation strategies, such as incorporating additional samples of exceptionally large or small mushrooms to enhance model adaptability.
7).TRAINING PROCESS LOSS AND INDEX CURVES
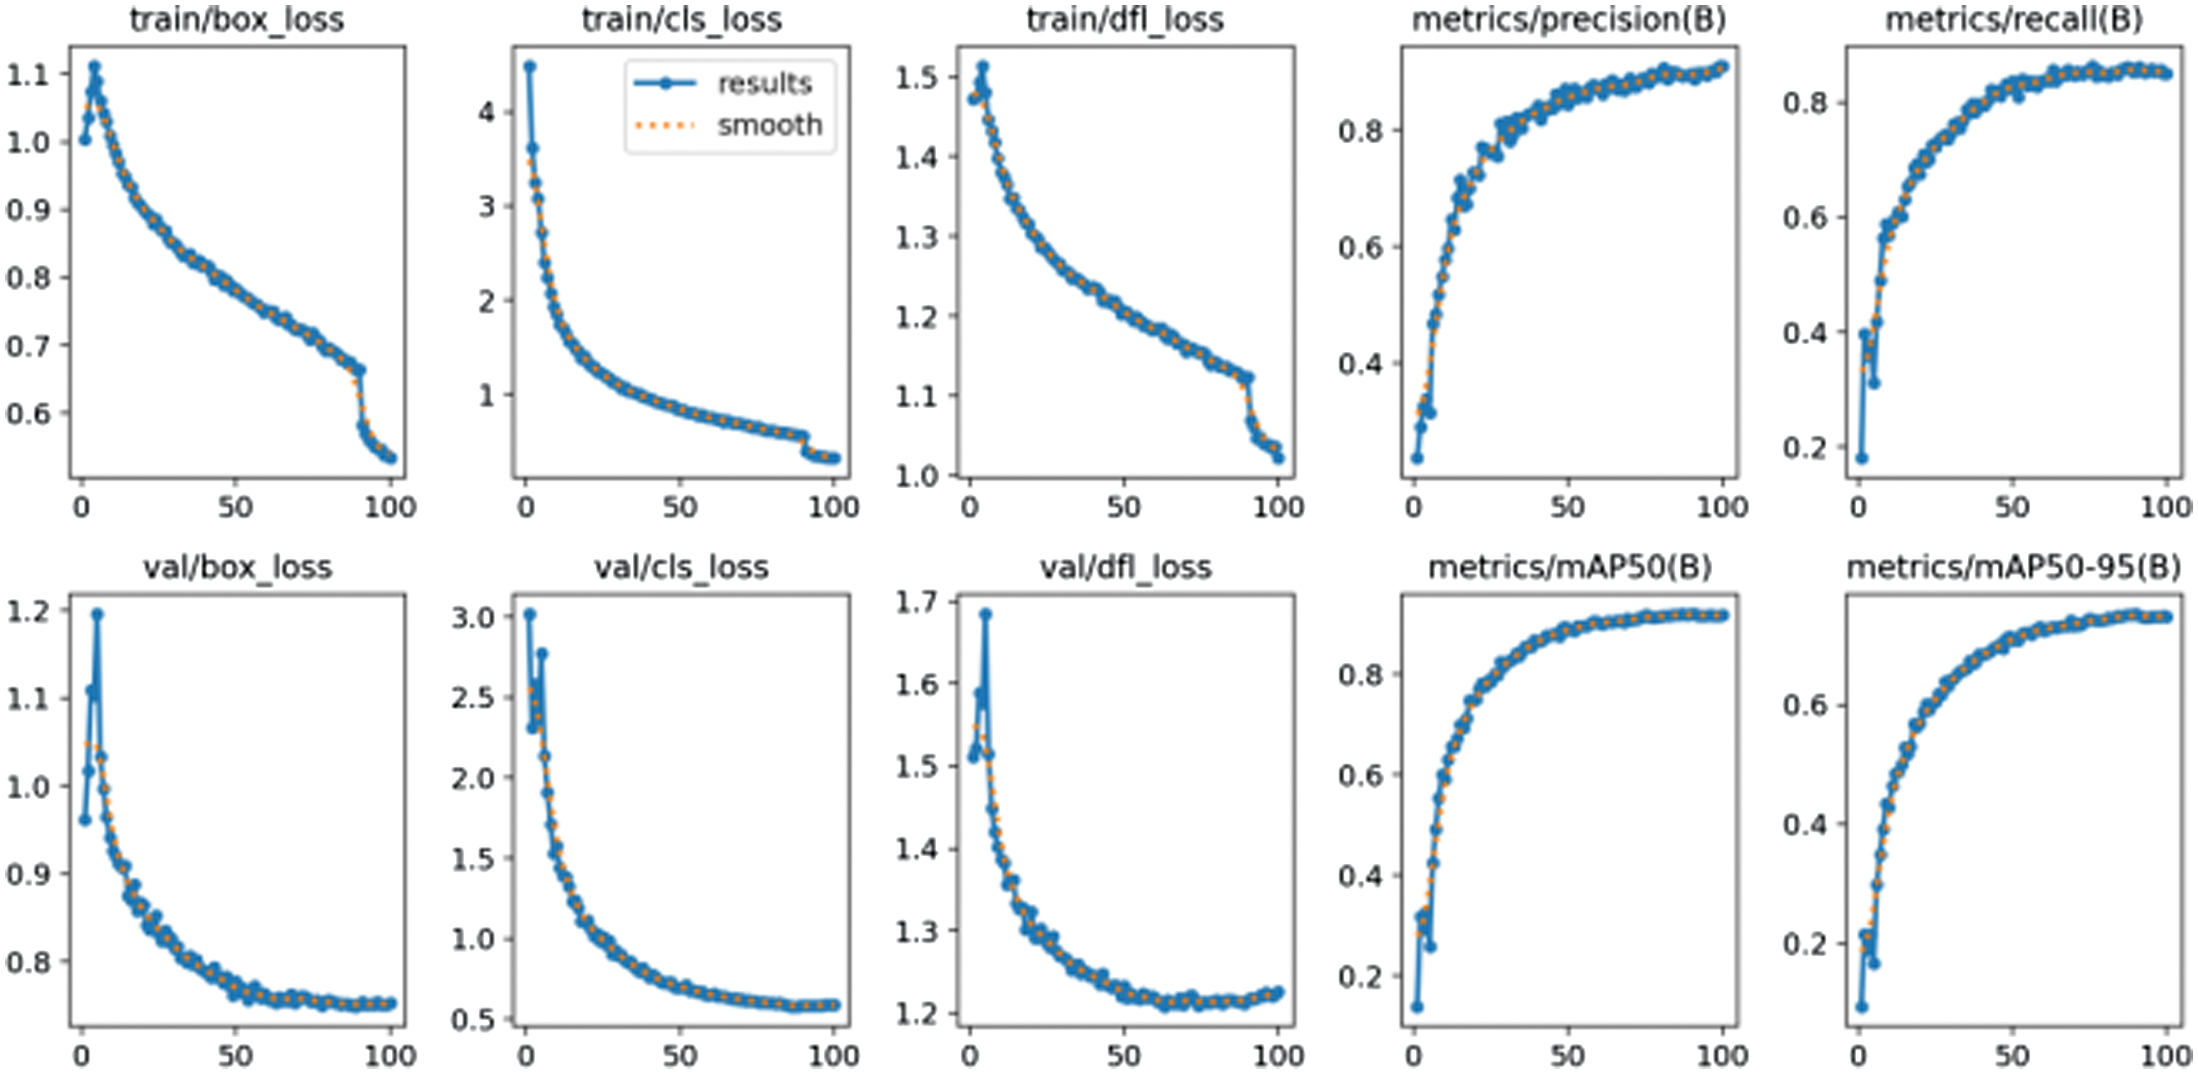
Figure 12 provided a complete overview of the training dynamics. The consistent decline in all loss components (box, class, and dfl) for both training and validation sets confirms stable optimization. The parallel rise and eventual plateau of precision, recall, mAP50, and mAP50-95 metrics indicate that the model converged effectively to a robust state after 100 epochs, having learned generalizable features for wild mushroom detection.
8).MODEL DETECTION CAPABILITY VERIFICATION:
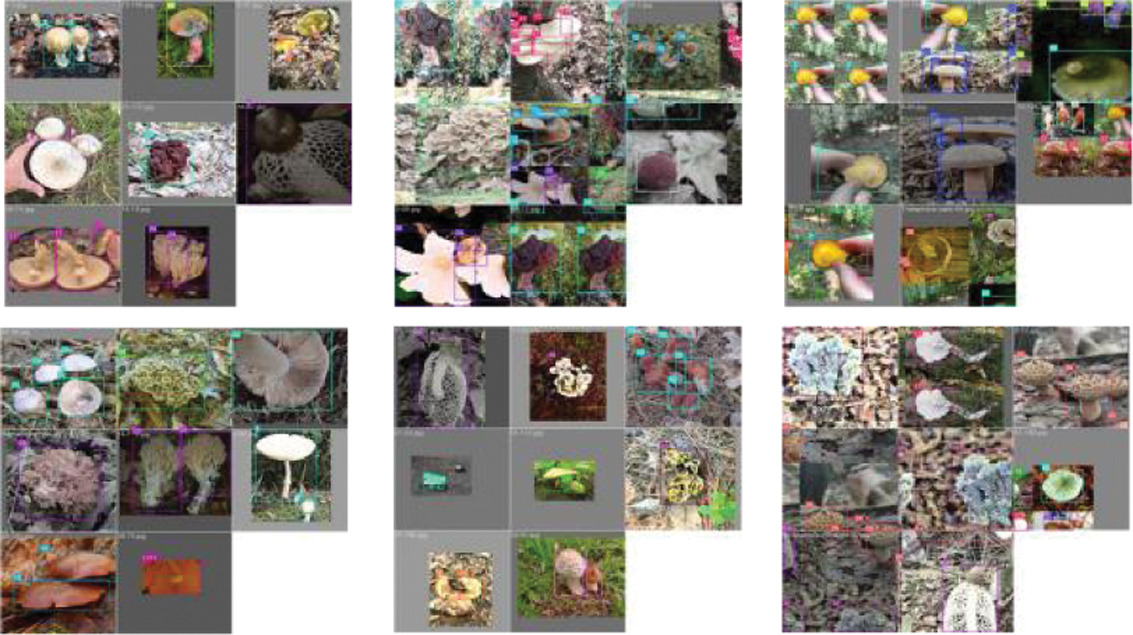
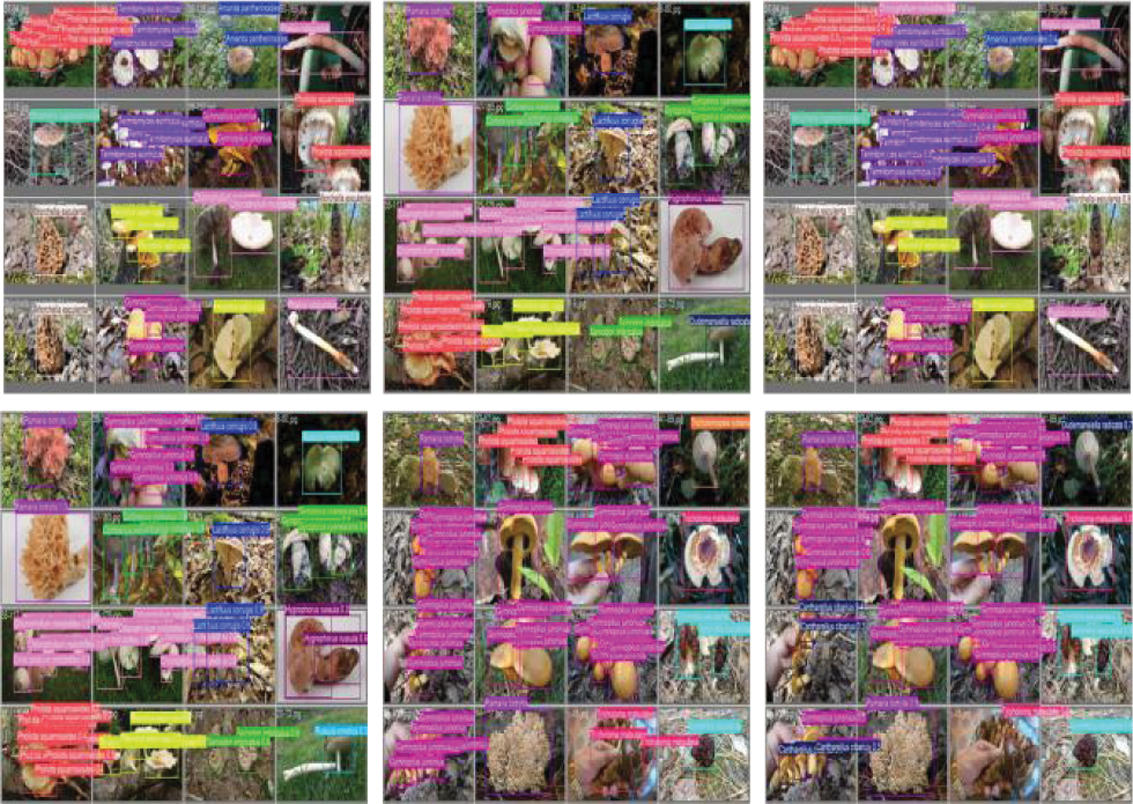
- (1)Detection Performance on Validation SetFigure 13 provided a composite view of detection outcomes on the validation set, illustrating the model’s effectiveness under diverse and challenging visual conditions.Single-Object Detection Accuracy. In images containing a single mushroom instance, the model demonstrated high precision in localization, producing bounding boxes that closely align with the true object boundaries. The correctly assigned class labels are consistent with the strong per-class accuracy observed in the confusion matrix (Fig. 9), confirming the model’s ability to accurately recognize distinct, well-defined targets. This performance indicates that the feature extraction and classification components of the model are effectively optimized for isolated objects in natural imagery.Multi-Object Detection Coverage. The model also performs reliably in images containing multiple mushroom instances. It successfully differentiates between overlapping or closely positioned objects [33] and accurately identifies multiple species within the same frame, as indicated by the distinct bounding box colors and corresponding labels. These results demonstrate the model’s capacity to generalize across complex visual compositions and its suitability for real-world scenarios involving multiple overlapping targets. The observed performance aligns with the model’s high recall and mAP scores, underscoring its consistent detection capability.Robustness in Field Conditions. All validation images were captured in natural outdoor environments featuring diverse background elements such as soil, leaves, and vegetation. Despite this visual clutter, the model maintains strong detection accuracy, effectively distinguishing mushrooms from non-relevant background textures. This robustness highlights the effectiveness of the field-collected training data in promoting generalization and resilience against environmental noise, thereby validating the model’s applicability to real-world ecological monitoring and field research contexts.
- (2)Confidence Explainability and Practical AdaptationFigure 14 offers an in-depth visualization of the model’s detection outputs, highlighting both the interpretability of its confidence scores and their implications for real-world application.Correlation between Precision and Confidence. The figure illustrates that mushrooms with distinct morphological features and clear visual contrast are consistently detected with high confidence values (≥0.9). These confident predictions align with precise bounding boxes and correct class assignments, reinforcing the empirical trend observed in the precision–confidence curve (Fig. 6). This correlation confirms that higher confidence levels generally reflect greater prediction accuracy, consistent with prior findings in model calibration and confidence estimation research [26].Practical Application Value. The visualization also demonstrates how confidence outputs can inform the design of UIs for field-deployable systems. For instance, detections with high confidence (e.g., highlighted in green) can be automatically accepted, whereas those with lower confidence (e.g., shown in red) may prompt manual verification by human operators. Such a confidence-based workflow establishes a feedback loop between automated inference and user decision-making, effectively balancing efficiency and reliability in applied contexts such as ecological monitoring or citizen science applications [27].Insight for Improvement. Furthermore, Fig. 14 serves as a diagnostic tool for identifying model weaknesses. Cases involving small, distant, or partially occluded mushrooms tend to yield lower confidence scores or false negatives, while rare species or those with close visual resemblance to others may be misclassified with moderate confidence. These insights provide practical guidance for targeted dataset enhancement—such as increasing representation of small or visually ambiguous specimens—and for refining model architectures or training strategies to improve sensitivity and generalization.
9).SUMMARY
In summary, the YOLO11n model, trained with a transfer learning strategy and a systematic configuration over 100 epochs, demonstrated fine and robust performance on the challenging task of wild mushroom recognition. The model achieved a high mAP50 of 91.8% and the mAP50-95 of 73.2% on a diverse test set of 40 species, underscoring its strong capability in both target localization and classification across a wide range of detection quality thresholds.
The comprehensive suite of evaluation curves provides deep insights into the model’s behavior. The F1–confidence curve confirms reliable predictions across a broad confidence range (0.2–0.8), the precision–confidence curve validates that high confidence equates to high accuracy, and the PR curve demonstrates an effective balance between identification accuracy and coverage. Furthermore, the normalized confusion matrix offers a transparent view of the model’s strengths and pinpoints specific confusions between morphologically similar species, which is inherent to the domain and provides a clear roadmap for future data-centric improvements.
Critically, the training process was stable and exhibited ideal convergence, with no signs of overfitting, indicating that the model learned generalizable features from the dataset. The label and coordinate distribution analyses confirmed the dataset’s diversity and its good alignment with the model’s anchor box design, justifying the chosen architecture and training approach. Finally, qualitative validation on the validation set confirmed the model’s practical utility, displaying accurate detection of single and multiple objects and robust performance in complex, natural backgrounds.
This thorough multidimensional evaluation confirms that the trained YOLO11n model is not only a high-performing classifier but also a robust detection system, achieving an optimal trade-off between accuracy, speed, and generalization. It thus forms a solid and reliable foundation for integration into the end-user application system described in the following section.
B.INTERFACE APPLICATION RESULTS
To fully validate the system’s practical application capabilities, this study conducted systematic functional testing and performance evaluation of the developed visual UI. The testing environment utilized a standard CPU computing device (without GPU acceleration) to simulate the hardware requirements of ordinary users. The system interface was built using the PyQt5 and Flask frameworks, employing a front-end and back-end separation architecture. It implemented a complete functional chain, including image uploading, model inference, result visualization, and data export.
1).SYSTEM ARCHITECTURE AND FUNCTIONAL IMPLEMENTATION
The system adopts a modular design and primarily consists of the following functional modules:
Image Processing Module: The load_image method implements image loading, supporting various formats such as JPG, JPEG, PNG, and BMP. The Image Display Module implements adaptive scaling through the show_image() method, ensuring that images of varying resolutions can be fully displayed within a fixed-size display area.
Preprocessing Module: The preprocess_image method strictly adheres to the YOLO training standard for image preprocessing, including scaling (scaling the long side to 960 pixels), gray padding, RGB format conversion, normalization, and dimension order adjustment. This normalization ensures consistency between input data and training data, improving model inference accuracy.
Inference Detection Module: The core detect_fungi method integrates the complete detection process. It first normalizes the input image and then calls the YOLO model for inference. Finally, the postprocess_detections method converts the detection results back to the original image size. This method also implements confidence threshold filtering, allowing users to adjust the detection sensitivity in real time using a slider. Results Visualization Module: The system draws colored detection boxes on the original image and uses a three-color system to identify the confidence level: high confidence (≥90%) appears in green, medium confidence (70%–90%) appears in orange, and low confidence (<70%) appears in red. This visual encoding method allows users to quickly identify the confidence level of the test results.
Data Management Module: The export_csv method exports test results, using UTF-8 with BOM encoding to ensure that the generated CSV files are compatible with common data processing software such as Microsoft Excel. The exported files contain complete information, including the ID, fungus name, confidence level, and processing time.
2).PERFORMANCE TEST RESULTS
Following extensive testing, the system exhibited strong overall performance across both efficiency and usability dimensions.
Recognition Efficiency. The system demonstrated high computational efficiency, achieving an average processing time of less than 1 second per wild mushroom image, inclusive of all stages—image preprocessing, model inference, and result rendering. Specifically, a 600 × 450-pixel image required approximately 324 milliseconds for full processing, while a 1280 × 720-pixel high-definition image took roughly 780 milliseconds. These results confirm that the system supports real-time recognition and satisfies the responsiveness required for interactive user operations, aligning with performance benchmarks typically expected in real-time computer vision applications [34].
Result Presentation and Interface Design. The recognition outcomes are displayed in a structured, user-friendly table comprising four key fields: ID (an automatically generated serial number), Mushroom Name (the Latin name of the identified species), Confidence (the model’s confidence score, presented to four decimal places), and Time (ms) (processing time in milliseconds). The table features a scrollable layout with color-coded confidence indicators, enhancing interpretability at a glance.
Users can export the recognition results to a standard CSV file via the “Export CSV” button for further data analysis or record-keeping purposes. The system interface also includes several interactive controls: “Clear” (to reset the workspace), “Start Recognition” (to initiate detection), “Export CSV” (to save results), “Help” (to access documentation), and “Back” (to return to the original image). Upon completion, the status bar clearly reports the summary message—“Recognition completed–Detected X mushroom types”—providing users with immediate, transparent feedback. The overall interface design thus integrates accuracy, interpretability, and efficiency to support seamless user interaction. The color-coded confidence system helps users make rapid safety judgments. User tests (n = 12) showed a 93.3% task success rate and 85.7% satisfaction score as illustrated in the accompanying image.
Figure. 15 displays the Mushroom Intelligent Recognition System version 1.1 UI, which operationalizes the YOLO11n model through an integrated, user-friendly application designed to facilitate practical mushroom identification. The interface architecture features an image preview panel on the left for specimen visualization, an adjustable confidence threshold slider (currently set at 0.65) in the upper right allowing users to modulate detection sensitivity, and a central results table displaying identification number, species name, confidence score, and processing time for systematic output presentation. A functional control toolbar at the bottom provides essential operations including image selection, interface clearing, recognition initiation, and CSV data export and help documentation access. This comprehensive design effectively bridges the gap between sophisticated deep learning capabilities and practical field applications, creating an accessible platform that accommodates users ranging from professional mycologists to citizen scientists while maintaining rigorous analytical standards through customizable confidence thresholds and detailed result documentation, thereby demonstrating successful translation of advanced computational techniques into a deployable tool for real-world biodiversity assessment and mushroom identification tasks.
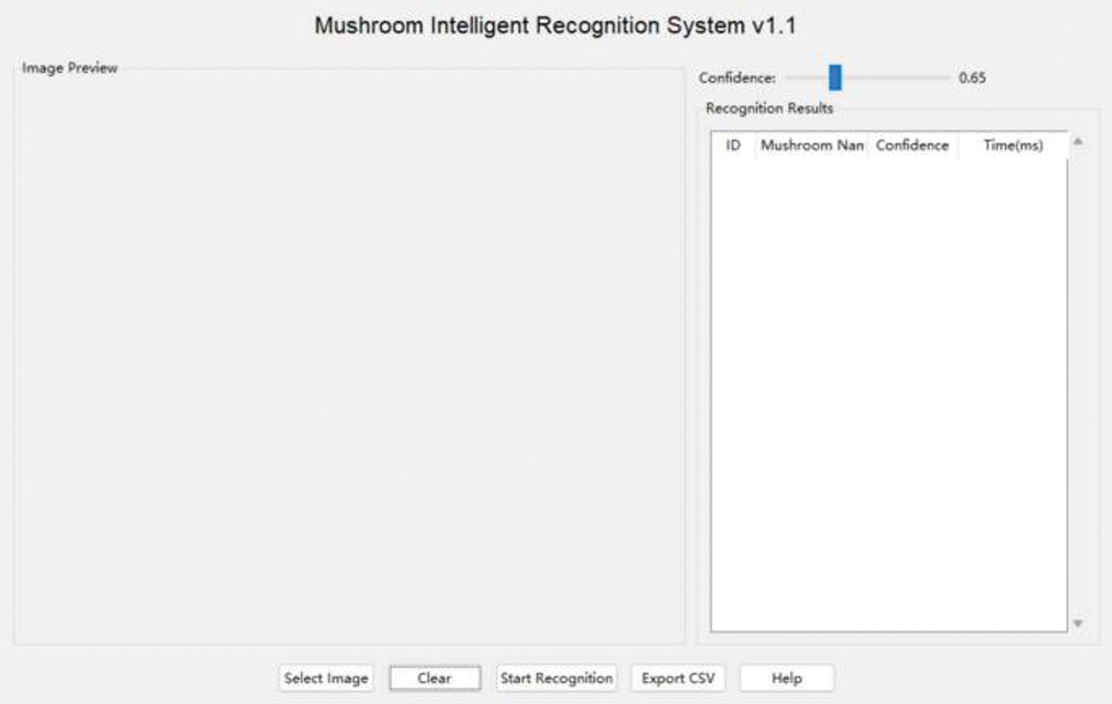 Fig. 15. Visualization window.
In terms of user experience, the overall operation process follows a classic three-step process: select an image → start recognition → view results, which aligns with the user’s mental model. The interface layout features a left-right column design, with the image preview area on the left and the results display area on the right, clearly categorizing functions. The control layout aligns with operational logic, and key function buttons use standard sizes and spacing to ensure efficient and accurate operation.
3).SPECIAL FUNCTION DESIGN
The system further incorporates several distinctive and user-oriented features designed to enhance flexibility, interpretability, and interactivity during operation.
Dynamic Confidence Adjustment. A real-time confidence threshold adjustment slider enables users to modify the detection threshold within a range of 0.5 to 1.0, offering an intuitive means to balance recall and precision according to specific application needs. Changes to the threshold are applied instantly, eliminating the need to reload or reprocess images. This functionality supports adaptive decision-making in field conditions, where users may prioritize either sensitivity or selectivity depending on environmental complexity and target visibility [27].
Intelligent Color Coding. To improve visual interpretability, detection results are automatically color-coded according to confidence levels: green for high confidence (≥ 90%), orange for moderate confidence (70%–90%), and red for low confidence (< 70%). This tri-level color scheme provides immediate, at-a-glance insight into the model’s prediction reliability, reducing cognitive load and aiding rapid human verification. As illustrated in the accompanying figure, this feature enhances transparency and trust in automated detections—an essential element in user-centered AI system design [35,36].
Figure 16 exemplifies the system’s operational performance through a multi-instance detection scenario where the YOLO11n model successfully identifies six Gymnopilus junonius specimens within a single natural habitat image, as indicated by green bounding boxes with overlaid species labels and confidence scores. The detection results demonstrate robust classification performance with confidence levels ranging from 0.80 to 0.93, all exceeding the configured threshold of 0.65, while maintaining consistent processing efficiency at 200.91 milliseconds per detection. This visualization validates the system’s capacity to handle complex field conditions involving multiple specimens with potential occlusions while delivering high-confidence classifications and real-time processing speeds, thereby confirming the practical applicability of the integrated YOLO11n-based recognition pipeline for authentic mushroom identification tasks in naturalistic settings.
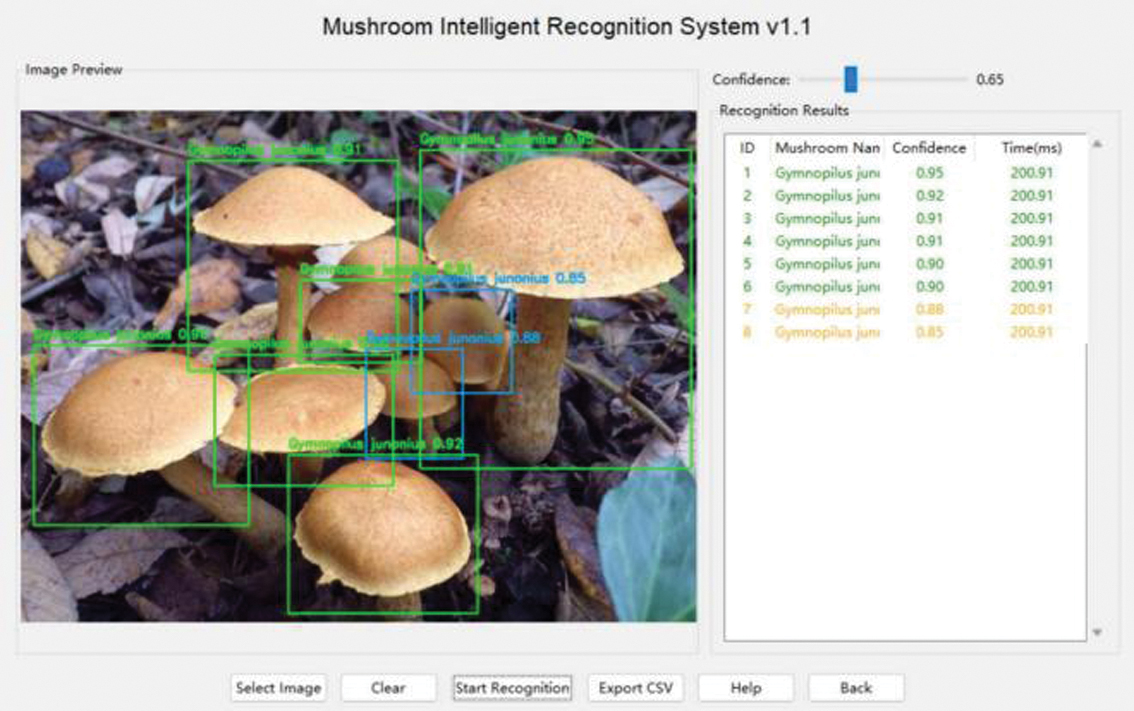 Fig. 16. Visualization of detection results.
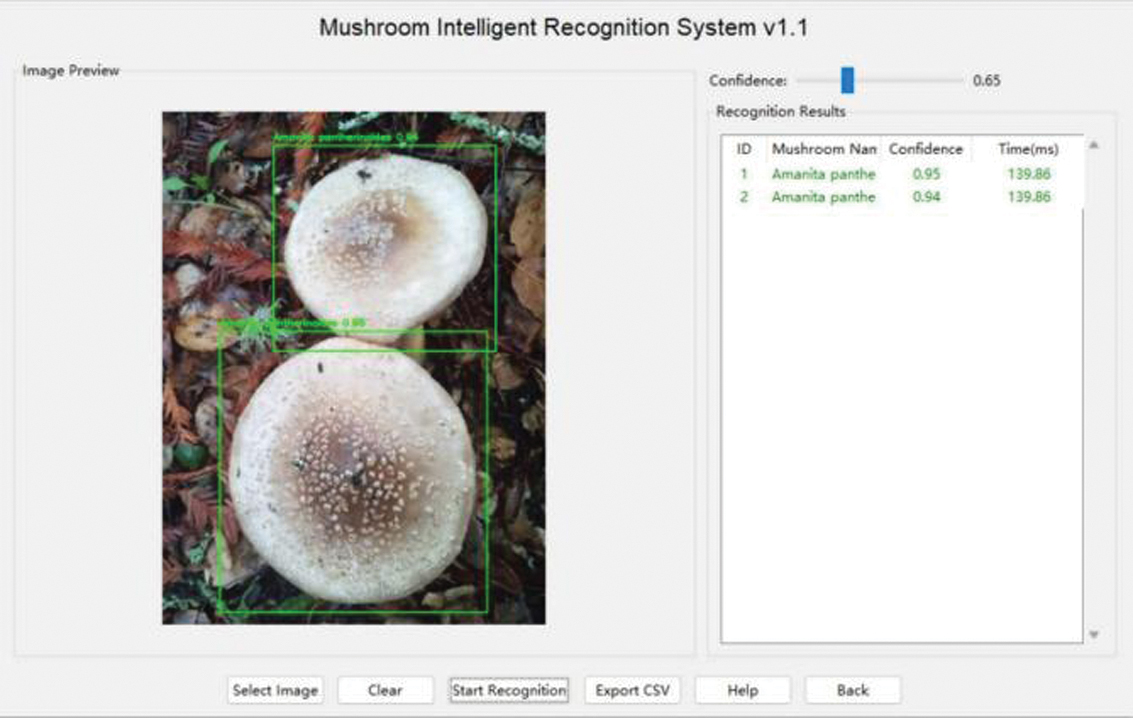
State recovery mechanism: A “Back” button allows users to return to the original image at any time, facilitating multiple rounds of detection and comparison of results. Detailed help system: A comprehensive user guide with operating instructions, color legends, and FAQs is integrated to reduce user learning curves. Test results show that the system meets design expectations in terms of recognition accuracy, responsiveness, and user experience. The interface design is simple and intuitive, with comprehensive and practical functions and a smooth operation process, fully meeting the needs of researchers and field workers for intelligent wild mushroom identification. Figure 17 shows the system’s recognition results for an image containing multiple wild mushrooms. Two Amanita pantherinoides specimens were successfully detected with confidence levels of 0.95 and 0.94, respectively, in 139.86 milliseconds. This demonstrates the system’s effectiveness and practicality in multi-target identification scenarios.
V.DISCUSSION
This study developed and validated an intelligent wild mushroom recognition system based on the YOLOv11n architecture and a visual UI. The system achieved an mAP50 of 91.8% across 40 wild mushroom species and supported inference within 1 second on a standard CPU, indicating a reasonable balance between detection accuracy and computational efficiency.
The improved performance of the proposed model can be attributed to the feature extraction capability of YOLOv11n and the use of transfer learning based on the COCO dataset. The model can capture discriminative morphological characteristics of mushrooms, leading to stable convergence and strong generalization ability in real-world scenarios. Compared with previous methods based on traditional machine learning or handcrafted features, the deep learning framework used in this study shows stronger robustness to lighting changes, occlusions, and complex backgrounds. Compared with YOLOv5 models applied in similar fungal recognition tasks, YOLOv11n provides higher feature fusion efficiency, which contributes to better detection precision and recall.
The UI is designed to support real-world usage, with functions including image upload, automatic detection, confidence visualization, and result export. The lightweight inference design enables the system to run efficiently without GPU acceleration, making it accessible for field researchers and the public.
Several limitations are observed in this work. First, the dataset presents class imbalance, with some species having fewer samples, which leads to relatively lower performance on these categories. Second, the model may produce misclassifications between morphologically similar species [37–39], as shown in the confusion matrix. Third, small or heavily occluded mushrooms remain difficult to detect accurately due to scale variation and partial feature loss.
Future improvements can be made in four aspects. First, the dataset can be expanded with more balanced samples and additional species. Second, the model can be further optimized with attention mechanisms or multi-scale feature fusion [40] to enhance small-object detection. Third, the system can be extended to support batch processing, video analysis, and mobile deployment for wider field applications. Fourth, functions such as toxic mushroom warning and similarity comparison can be integrated to strengthen practical value.
Overall, this work provides a deployable intelligent system for wild mushroom recognition. The integration of detection algorithm and UI supports practical usage in biodiversity monitoring and public health safety. With further optimization, the system can be more robust and adaptable to real-world ecological scenarios.
VI.CONCLUSION
This study constructed a lightweight wild mushroom detection system based on the YOLOv11n model. Two core specific findings are summarized as follows.
First, the proposed model achieves an mAP50 of 91.8% ± 0.6% on the test set containing 40 wild mushroom species and supports real-time inference within 1 second on ordinary CPU devices without GPU acceleration. The main confusion occurs between two groups of morphologically similar mushroom species, which is consistent with fungal taxonomic characteristics.
Second, the improved YOLOv11n structure with optimized C2F module and feature fusion network achieves better lightweight efficiency and small-object detection performance compared with YOLOv8n and YOLOv5n models. The data augmentation and class-weighted loss strategy effectively alleviate the negative impact of class imbalance.
The system provides a practical solution for field wild mushroom identification and public safety warning. Limitations including insufficient balanced samples and poor performance on heavily occluded targets still exist. Subsequent research will expand the dataset and optimize multi-scale detection performance to further improve model robustness.