I.INTRODUCTION
Breast cancer is one of the primary health concerns affecting women in the world, and the burden associated with it continues to increase in both developed and developing countries [1]. To help manage and treat patients, and to reduce mortality and avoid needless biopsies, lesion characterisation and early lesion detection are important [2]. Of all imaging methods, breast ultrasound is most often used in routine clinical practice because it is more affordable and accessible, especially useful for evaluating dense breast tissue [3]. However, the interpretation of ultrasound images is often bilateral and heavily reliant on the interpreting clinician’s skill, and the images are often marred by speckle noise, poor contrast, and acoustic shadows and are affected by variability between lesions [4]. These problems have fuelled ongoing efforts to use deep learning techniques to create computer-aided diagnostic systems for automated analysis of breast ultrasounds.
Recent work showed promise in breast ultrasound classification using deep learning models with transfer learning and modern convolutional backbones [6]. In the case of public ultrasound datasets, it was also found that no single network achieved overall robustness, attributed to disparities in presentation and acquisition configurations, as well as dataset composition [7]. When private datasets, especially institution-specific datasets such as internal datasets, were used, generalisation was more critically affected by differences in image distribution, class composition, and the instructions given to annotators regarding classification [8]. In parallel, the most relevant studies that used benchmarks also showed that dataset quality, class diversity, and the processes involved in dataset formation have a significant impact on the clinical usefulness of breast ultrasound AI systems [9]. The evidence also indicated that, even though progress was made in the area, the performance improvements observed on single datasets were likely to provide very little indication of performance stability and reliability in practice, confirming the inconsistency in the field.
There was a research gap that remained strong in the handling of the imbalance of classes, especially in a tri-class breast ultrasound system that covers benign, malignant, and normal classes [10]. Historically, a significant number of studies have focused solely on benign-versus-malignant discrimination and therefore often omit the normal category, yet the clinical need for proper recognition of normal tissue to reduce false-positive findings and unnecessary clinical interventions during diagnostic evaluation. With the inclusion of normal class, its representation was usually underrepresented relative to lesion classes, leading to model bias towards abnormal patterns during training. Even though other studies attempted to mitigate imbalance using generic data augmentation, synthetic oversampling, or GAN-based image synthesis, these interventions were typically implemented at a larger scale rather than explicitly applied to the rare class that actually posed the bottleneck [11]. Besides, most of these methodologies focused on numeric balance, compromising on the realistic appearance of ultrasound and, hence, the clinical relevance of the images generated or transformed.
The second lacuna occurred in the correlation between gains in performance and model interpretability. Elaborate representations began to appear in breast ultrasound classification, and Grad-CAM-style visual representations were used more often to emphasise image regions that affected model outcomes [5]. However, interpretability was often added after the development of the model instead of being built during its development along with the data issues that determine model behaviour [5]. In turn, the visual explanations would not provide reliable decision boundaries if the training data were markedly imbalanced and poorly representative of normal tissue. The given limitation highlighted the importance of considering performance, data quality, and interpretability as a set of interrelated issues rather than three independent factors [12].
Another weakness of the available literature was the lack of rigorous ablation studies that could have separated the impact of data balancing from that of classifier architecture [7]. Based on this, it was unclear whether the reported improvements were due to the backbone network, an attention mechanism, preprocessing strategies, or the balancing strategy itself [6]. This uncertainty is particularly relevant to modern attention-enhancing architectures, in which attention modules can maximise feature discrimination but can only be assessed reliably under clear control of data imbalance [12]. Thus, there was an obvious need for investigations to evaluate the possibility of a significant positive impact of the requested remediation of rare normal cases in classes on the classification of tri-class breast ultrasound under a controlled ablation scheme.
This gap led to the present study. It used a composite dataset of breast ultrasounds, where the norm group was grossly underrepresented, and it did not consider this as a preprocessing issue but rather a major research issue. It was assumed that the absence of a normal category is not merely a statistical inconvenience but it is also a structural weakness which can push the limits of decision-making, make false positives more likely, and reduce the usefulness of automated systems in the real world [10]. The work directly met the need for the classification of breast ultrasound images using diagnosically relevant and experimentally valid imbalanced classification training which intentionally included the absence of normal tissue in a tri-class classification [8].
Novelty of the current study is the formulation of the problem and the strategy of its validation. The research work is helping to fill the gap in the literature for predicting the expansion of the rare normal group in a combined breast ultrasound dataset, evaluating its quality by training an attention-based deep learning model, and demonstrating the benefit by direct ablation with a non-augmented control. Furthermore, it improves the predictive performance of the baseline model by also giving a visual interpretation of the model that is explainable to humans and includes an interface suitable for deployment, making the model development process more aligned with the realistic expectations of clinical decision support [5]. The article, therefore, not only provides better diagnostic results but also a holistic view of the joint resolution of class imbalance, explainability, and deployability of breast ultrasound images during classification.
The remainder of the paper is organised as follows: The existing literature and methods are reviewed in Section II. The methodology proposed is detailed in Section III. Experimental results and discussion are given in Section IV. Lastly, key findings, limitations, and future research directions are presented.
II.RELATED THEORY
The theoretical groundings of the study are computer-aided diagnosis of breast ultrasound, imbalanced learning, attention-based representation, and explainable decision support. Advantages of integrating lesion knowledge with image classification have been demonstrated for previous fully automated pipelines that operate independently of the two problems [13]. However, such pipelines were primarily developed via benign-malignant discrimination and tacitly accepted that lesion-centric processing would suffice to enhance the diagnostic performance. In practice, this assumption proved to be inadequate for the three classes as the image of the normal tissue class was often much weaker than that of the abnormal class. This resulted in the current study going beyond the mere characterisation of the lesions, and it was also important to investigate the effects of the absence of normal samples, as these can introduce some bias in the decision envelope learnt by the classifier.
Deep feature fusion is one approach used to improve breast ultrasound classification. It combines augmented ultrasound data, transfer learning, and feature optimisation to improve class discrimination [14]. This literature shows that fused representations can improve prediction when inter-class similarity is high. However, such methods often depend on global feature extraction and downstream feature selection. They do not directly evaluate whether the model has learned a representative concept of normal breast tissue. Therefore, feature fusion does not fully solve the class-distribution problem when one class is structurally undersampled. Attention theory has developed into a stronger alternative, as it aims to eliminate irrelevant background information and enhance diagnostically useful structures. Previous research indicated that auxiliary attention-based learning can simultaneously enhance localisation and classification of breast ultrasound by relating lesion-sensitive features with diagnostic judgements [15]. This theoretical orientation is important, as ultrasound images have low contrast, poor edges, and a lot of background noise. However, attention-based models also uncovered one major constraint: in cases where attention is closely linked to lesion localisation, the advantage requires the presence of lesion-based supervision/spatial priors. This yields a viable discontinuity in the classification settings, where the main issue is not determining where a lesion is actually situated, but rather how the model should respond when there is no lesion at all.
The second necessary foundation is the imbalanced learning theory. Singh et al. argued that traditional focal loss may be insufficient when minority classes are poorly represented during mini-batch optimisation [16]. In more general terms, Hellin et al. have shown that class imbalance not only reduces the overall increase in accuracy but also systematically alters the predictive behaviour of deep models, often to the disadvantage of minority-class recognition and overestimating the performance of dominant-class success [17]. The results directly apply to three-class breast ultrasound classification because a small normal class may provide apparently satisfactory aggregating results, yet will not be able to produce reliable normal-abnormal distinction. In this way, the problem remains; however, it is not a generic imbalance but rather one that, in a disproportionately negative way, compromises clinical meaningfulness in identifying normal tissue.
The weaknesses in the representation were gradually replaced by subsequent studies in breast ultrasound using multitask and attention-enhanced learning. Simultaneously, segmentation and classification approaches evolved toward attention-guided architectures for improved lesion characterisation. An ACSNet was proposed by He et al. to combine multiscale connectivity and attention-directed feature interaction to enhance the analysis of breast tumours in ultrasound [18]. Ru et al. also highlighted the multi-centre strength and spatial and geometrical learning, stating that the classification should provide local appearance and structure information for data sets [19]. The growth of these developments contributed to theoretical knowledge about the learning of context-sensitive features but also to a significant weakness. The majority of these systems still emphasise more classifications of tumours and require more advanced forms of annotation, like segmentation masks or multi-centre fine-tuning steps [18]. In turn, they are more effective at lesion description and dataset generalisation, but not at explicitly correcting the rare normal-class underrepresentation, which remains unaddressed.
This theoretical trend can be observed in more elaborate diagnostic models. Bobowicz et al. integrated segmentation and BIRADS-based ensemble classification and showed that it was possible to build interpretable diagnostic pathways using breast ultrasound data [20]. Latha et al. then demonstrated that EfficientNet-based, augmented, and explainable AI classification can achieve very competitive three-class breast ultrasound results [21]. Such contributions validate the idea that augmentation, salient-region attention, and interpretability are likely to improve automated diagnosis [20]. Previous augmentation plans, however, have generally been general, model-focused, or lesion-focused rather than focused on the infrequent category that least supports learning [21]. As a result, the field has yet to provide clear theoretical evidence that selective enhancement of the normal class can indeed improve class-balanced decision-making, rather than simply increasing the overall size of the dataset.
Explainability theory has also become increasingly topical as deep learning systems approach clinical implementation. Reviewed by Gurmessa and Jimma, explainable machine learning is used to diagnose breast cancer using mammography and ultrasound, and these visual explanation methods are commonly used to enhance transparency and trust [22]. Nonetheless, the theoretical weakness of explainability by post hoc is that clear saliency maps may provide a visual representation of where a model pays attention to, but does not ensure that a model has been trained on a balanced and representative distribution [22]. In a similar work, Boro and Nandi demonstrated that feature refinement with CBAM can significantly enhance the quality of breast ultrasound segmentation, supporting the idea that channel-spatial attention can enhance clinically relevant representations in the presence of noisy ultrasound [23]. Nonetheless, the segmentation-based attention does not directly address the question of whether a classifier has learnt to identify normal tissue as a distinct class rather than the absence of pathology [24].
It is within this context that the outstanding problem in the area can be formulated as follows: existing researchers have enhanced analysis of breast ultrasound by feature fusion, attention mechanisms, multitask optimisation, augmentation, and explainability, but they have not sufficiently separated the role of rare normal-class scarcity in merged three-class datasets [14]. The present work addressed that theoretical gap by reframing imbalance correction around the underrepresented normal category and evaluating its effect in a controlled ablation setting.
III.METHODOLOGY
This study addressed three-class breast ultrasound image classification using a merged dataset containing benign, malignant, and normal images. The central problem was severe class imbalance, particularly the scarcity of normal images. Let the dataset be denoted by
where represented an ultrasound image and represented the class label corresponding to benign, malignant, and normal, respectively. The merged dataset comprised of 1517 benign images, 1033 malignant images, and 133 normal images. This was an imbalance that suggested that a typical classifier would be biased toward abnormal classes and would learn a poor representation of normal tissue. While the aforementioned breast ultrasound studies demonstrated the value of strong representation learning, attention-focused diagnosis, imbalance-aware optimisation, and explainable prediction, they did not directly address the issue of scarce samples of the normal class in a controlled setting of 3 classes.A.OVERALL WORKFLOW
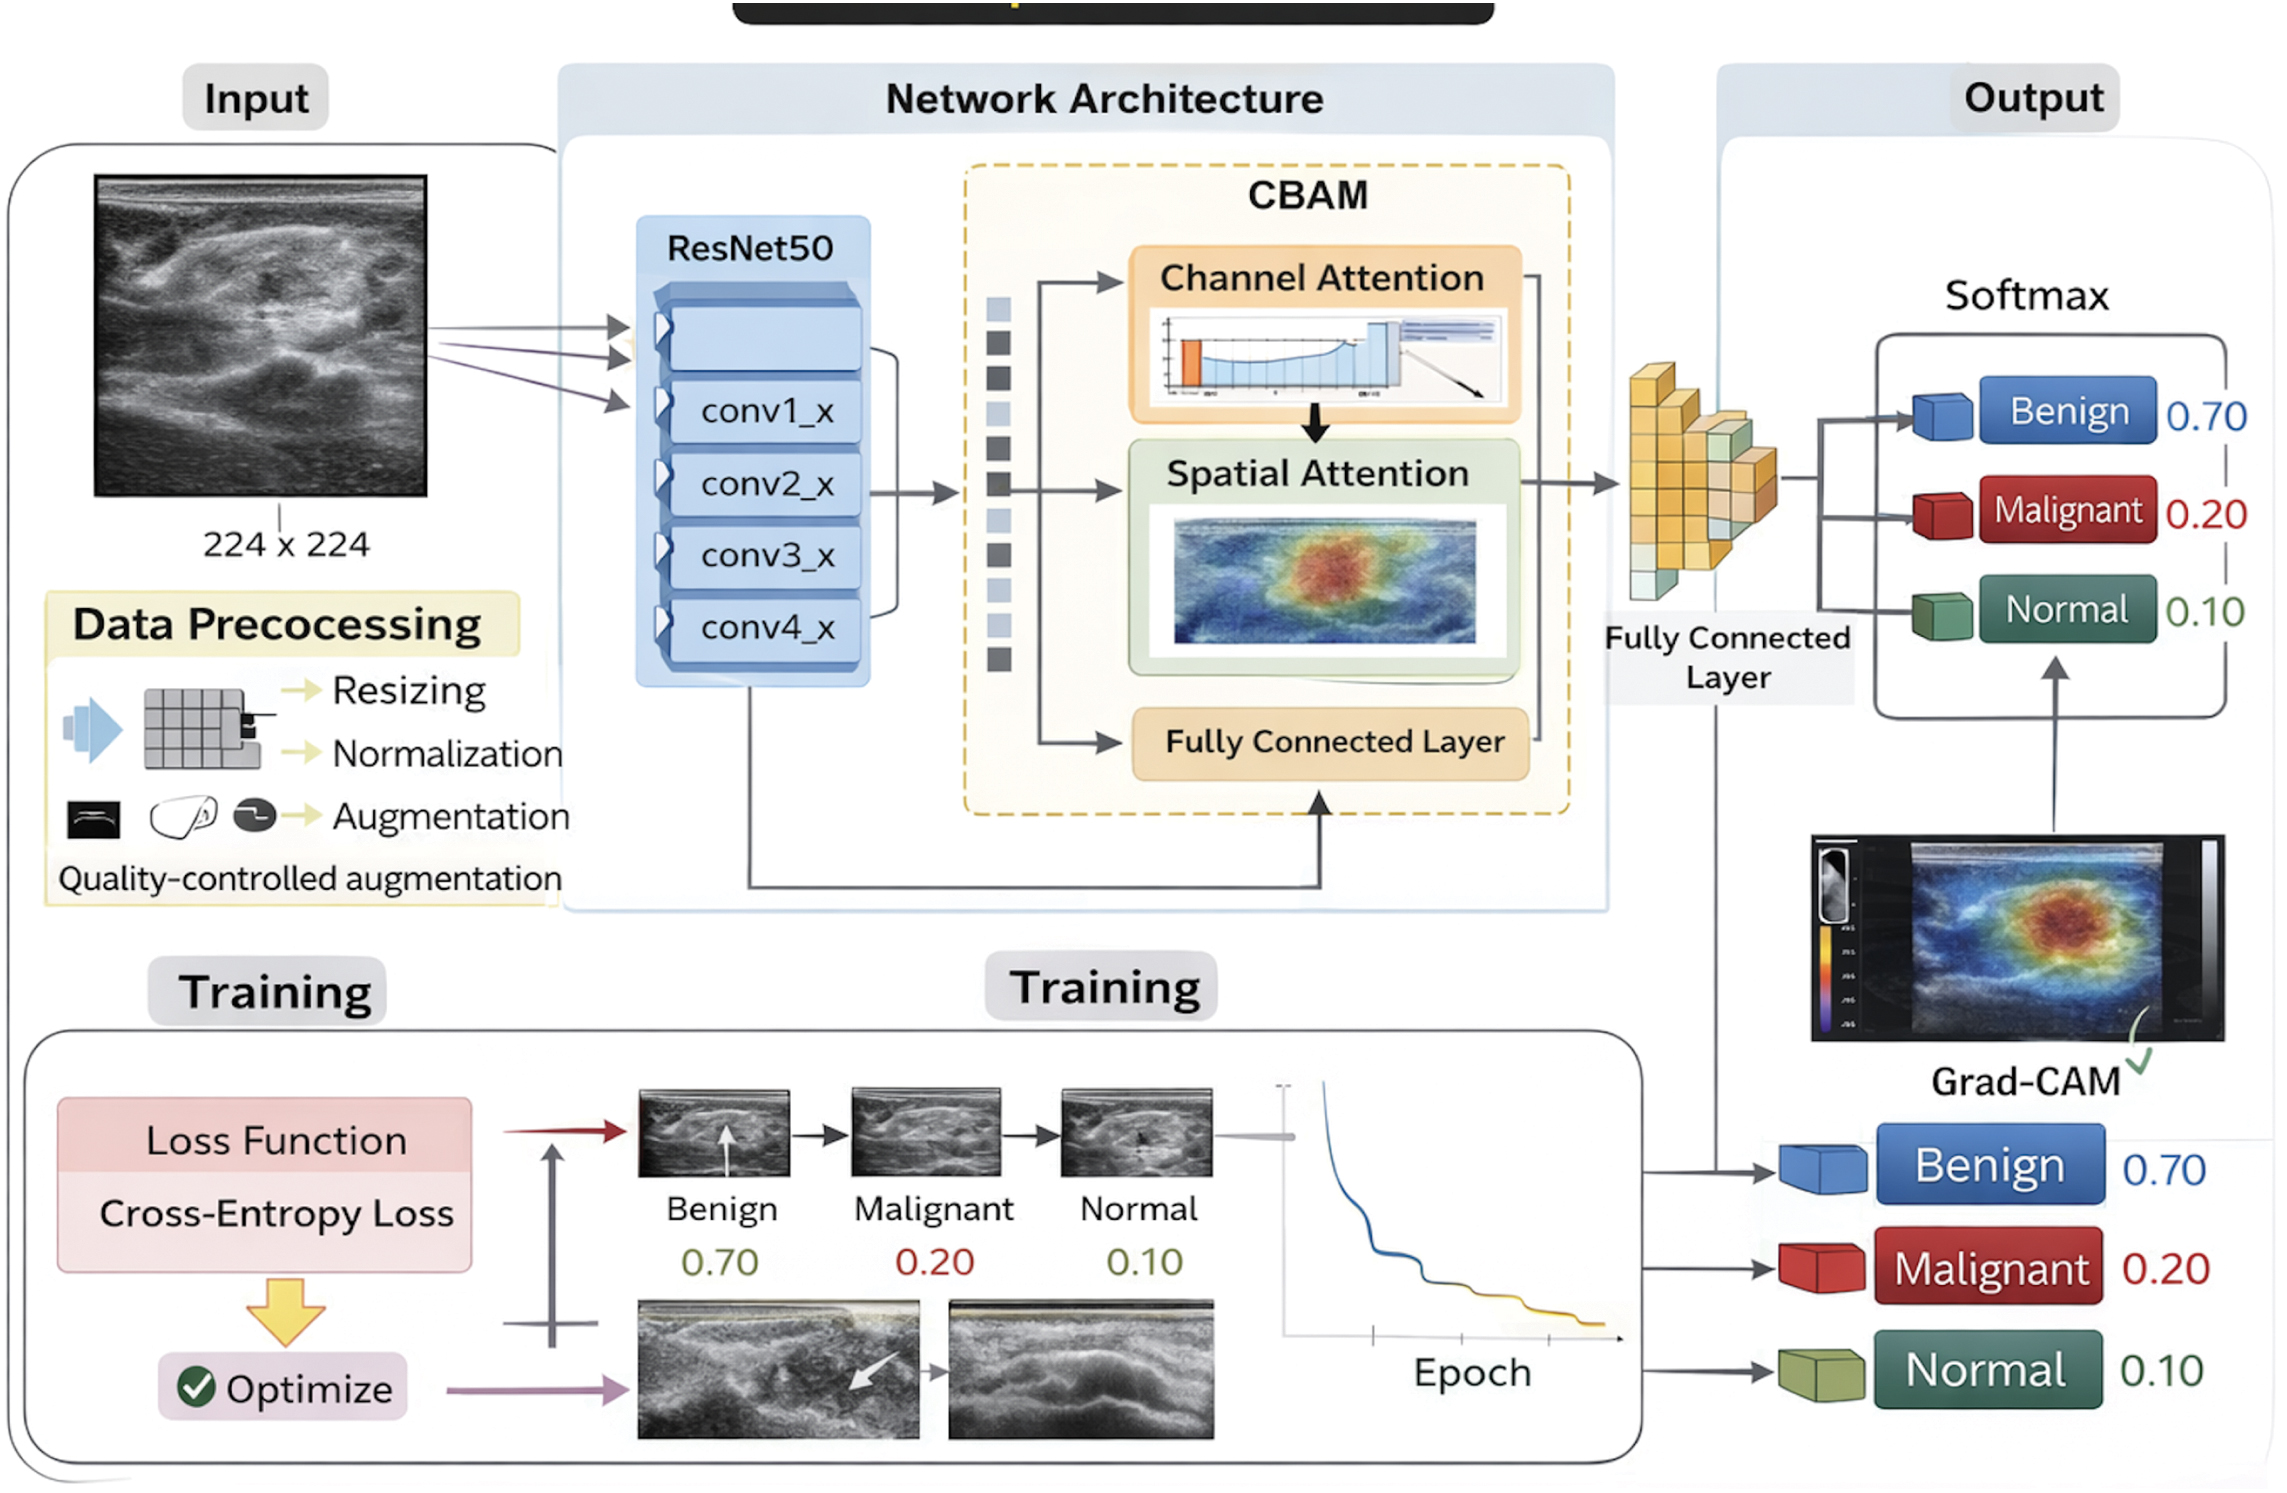
The proposed methodology, as shown in Fig. 1, followed a chronological pipeline:
- 1.Data preparation and class auditing
- 2.Targeted augmentation of the normal class
- 3.Quality-controlled acceptance of augmented normal images
- 4.Construction of the final balanced dataset
- 5.Training of a ResNet50-CBAM classifier
- 6.Five-fold cross-validation on the development split
- 7.Held-out test evaluation
- 8.Grad-CAM-based explainability and deployment
B.PROBLEM DEFINITION
The objective was to learn a mapping
where denoted the trainable parameters of the network and was the predicted class. The classification objective was formulated as minimising a class-imbalance-aware loss over the training set:However, because the normal class was underrepresented, the empirical distribution
created a skewed optimisation problem. To address this, the study did not augment all classes uniformly. Instead, it selectively enriched only the normal class until its sample count increased from 133 to 800. This reframed the learning problem as one of rare normal-class enhancement rather than generic augmentation.C.DATA PREPARATION AND DATASET PARTITIONING
All images were organised into three folders corresponding to benign, malignant, and normal classes. Each image was resized to 224 × 224 pixels for compatibility with ResNet50. The full dataset was first divided using a stratified 80:10:10 split, where 10% of the images were reserved as a held-out test set and the remaining 90% constituted the development set. The development set was then used for 5-fold stratified cross-validation.
Formally, if and denote the development and test sets, then
Five-fold cross-validation on produced training-validation partitions
Targeted normal-class augmentation
The proposed augmentation stage was performed offline and applied only to the normal class. Let denote an original normal image. A candidate augmented image was generated by composing mild ultrasound-consistent transformations:
The candidate transformations included the following:
- •small affine rotation in the range
- •scale variation in the range [0.98,1.02]
- •translation up to ±2%
- •optional horizontal flip with probability 0.25
- •gain and contrast adjustment
- •gamma correction
- •speckle-noise injection
- •mild Gaussian blur
- •CLAHE enhancement with limited clip range
The augmentation pipeline did not apply all transformations at once. Each candidate image first received a mild affine perturbation. Then, one or two ultrasound-consistent appearance transformations were randomly applied. These included gain-contrast adjustment, gamma correction, speckle-noise injection, mild blur, or CLAHE enhancement.
D.QUALITY-CONTROL FILTERING
Blind augmentation can introduce unrealistic texture distortion in ultrasound images. Therefore, each candidate augmented normal image was passed through a quality-control gate. Two variables were measured:
- 1.Laplacian variance, used as a sharpness criterion:
- 2.Histogram correlation, used as an intensity-distribution consistency criterion: where denotes the grayscale histogram.
A candidate image was accepted only if
This acceptance rule ensured that the generated sample remained sufficiently sharp and did not deviate excessively from the original ultrasound intensity profile. Using this controlled procedure, the normal class was increased from 133 to 800 images.
E.NETWORK ARCHITECTURE
The classification backbone was ResNet50 enhanced with the Convolutional Block Attention Module (CBAM). ResNet50 was chosen because residual learning stabilises optimisation in deep CNNs by learning
where is the residual mapping. CBAM was added after the deeper residual stages to refine channel and spatial attention.For an intermediate feature tensor , CBAM first applied channel attention:
then spatial attention:The refined feature map became
Loss function and imbalance-aware training
Training used class-balanced focal loss. If denotes the number of samples in class , the effective number of samples was defined as
and the class weight was computed asThese weights were normalised across classes. The focal loss for a sample was then
where is the predicted probability of the true class, β = 0.9999, and γ = 2.0A weighted random sampler was also used during training to ensure minority-class samples appeared more frequently in mini-batches.
F.PSEUDOCODE OF THE PROPOSED METHOD
| Input: Original merged dataset D with classes {benign, malignant, normal} |
| Output: Trained ResNet50-CBAM model and evaluation metrics |
| 1. Read all images from D |
| 2. Count class frequencies |
| 3. Select only normal-class images for offline augmentation |
| 4. For each normal image: |
| Generate candidate transformed image |
| Compute Laplacian variance |
| Compute histogram correlation with original |
| If quality thresholds are satisfied: |
| Accept and save augmented image |
| 5. Stop when normal count reaches 800 |
| 6. Build final dataset D* |
| 7. Perform stratified 80:10:10 split into development and held-out test sets |
| 8. Apply 5-fold stratified CV on the development set |
| 9. For each fold: |
| Create train and validation loaders |
| Use WeightedRandomSampler on training set |
| Initialise ResNet50-CBAM |
| Train with AdamW and Class-Balanced Focal Loss |
| Save the best model based on validation Macro-F1 |
| 10. Evaluate best fold models on the held-out test set |
| 11. Compute Accuracy, Precision, Recall, Macro-F1, AUC, Sensitivity, Specificity |
| 12. Generate Grad-CAM for interpretability |
G.SAMPLE EXAMPLE
Consider one normal ultrasound image from the original dataset. A candidate augmented version was produced using a mild affine transformation and low-level speckle injection. Suppose the candidate satisfied and . Both were above both thresholds of acceptability and so the candidate was kept. This procedure was carried out until the normal class size was 800. In the training set, this enhanced normal class benefitted in its ability to represent non-lesion tissue, which decreased the bias toward abnormal predictions. Figure 2 shows an example of the proposed augmentation strategy on a representative ultrasound image. Various mild transformations consistent with ultrasound data were synthesised from the original image, such as affine perturbation, gain–contrast adjustment, gamma correction, speckle-noise simulation, CLAHE enhancement, and Gaussian smoothing. The transformations were deliberately made to be small enough not to alter the anatomical texture or greyscale appearance. The enhanced images, therefore, retained the basic ultrasound structure, with an added diversity in acquisition-like appearance.
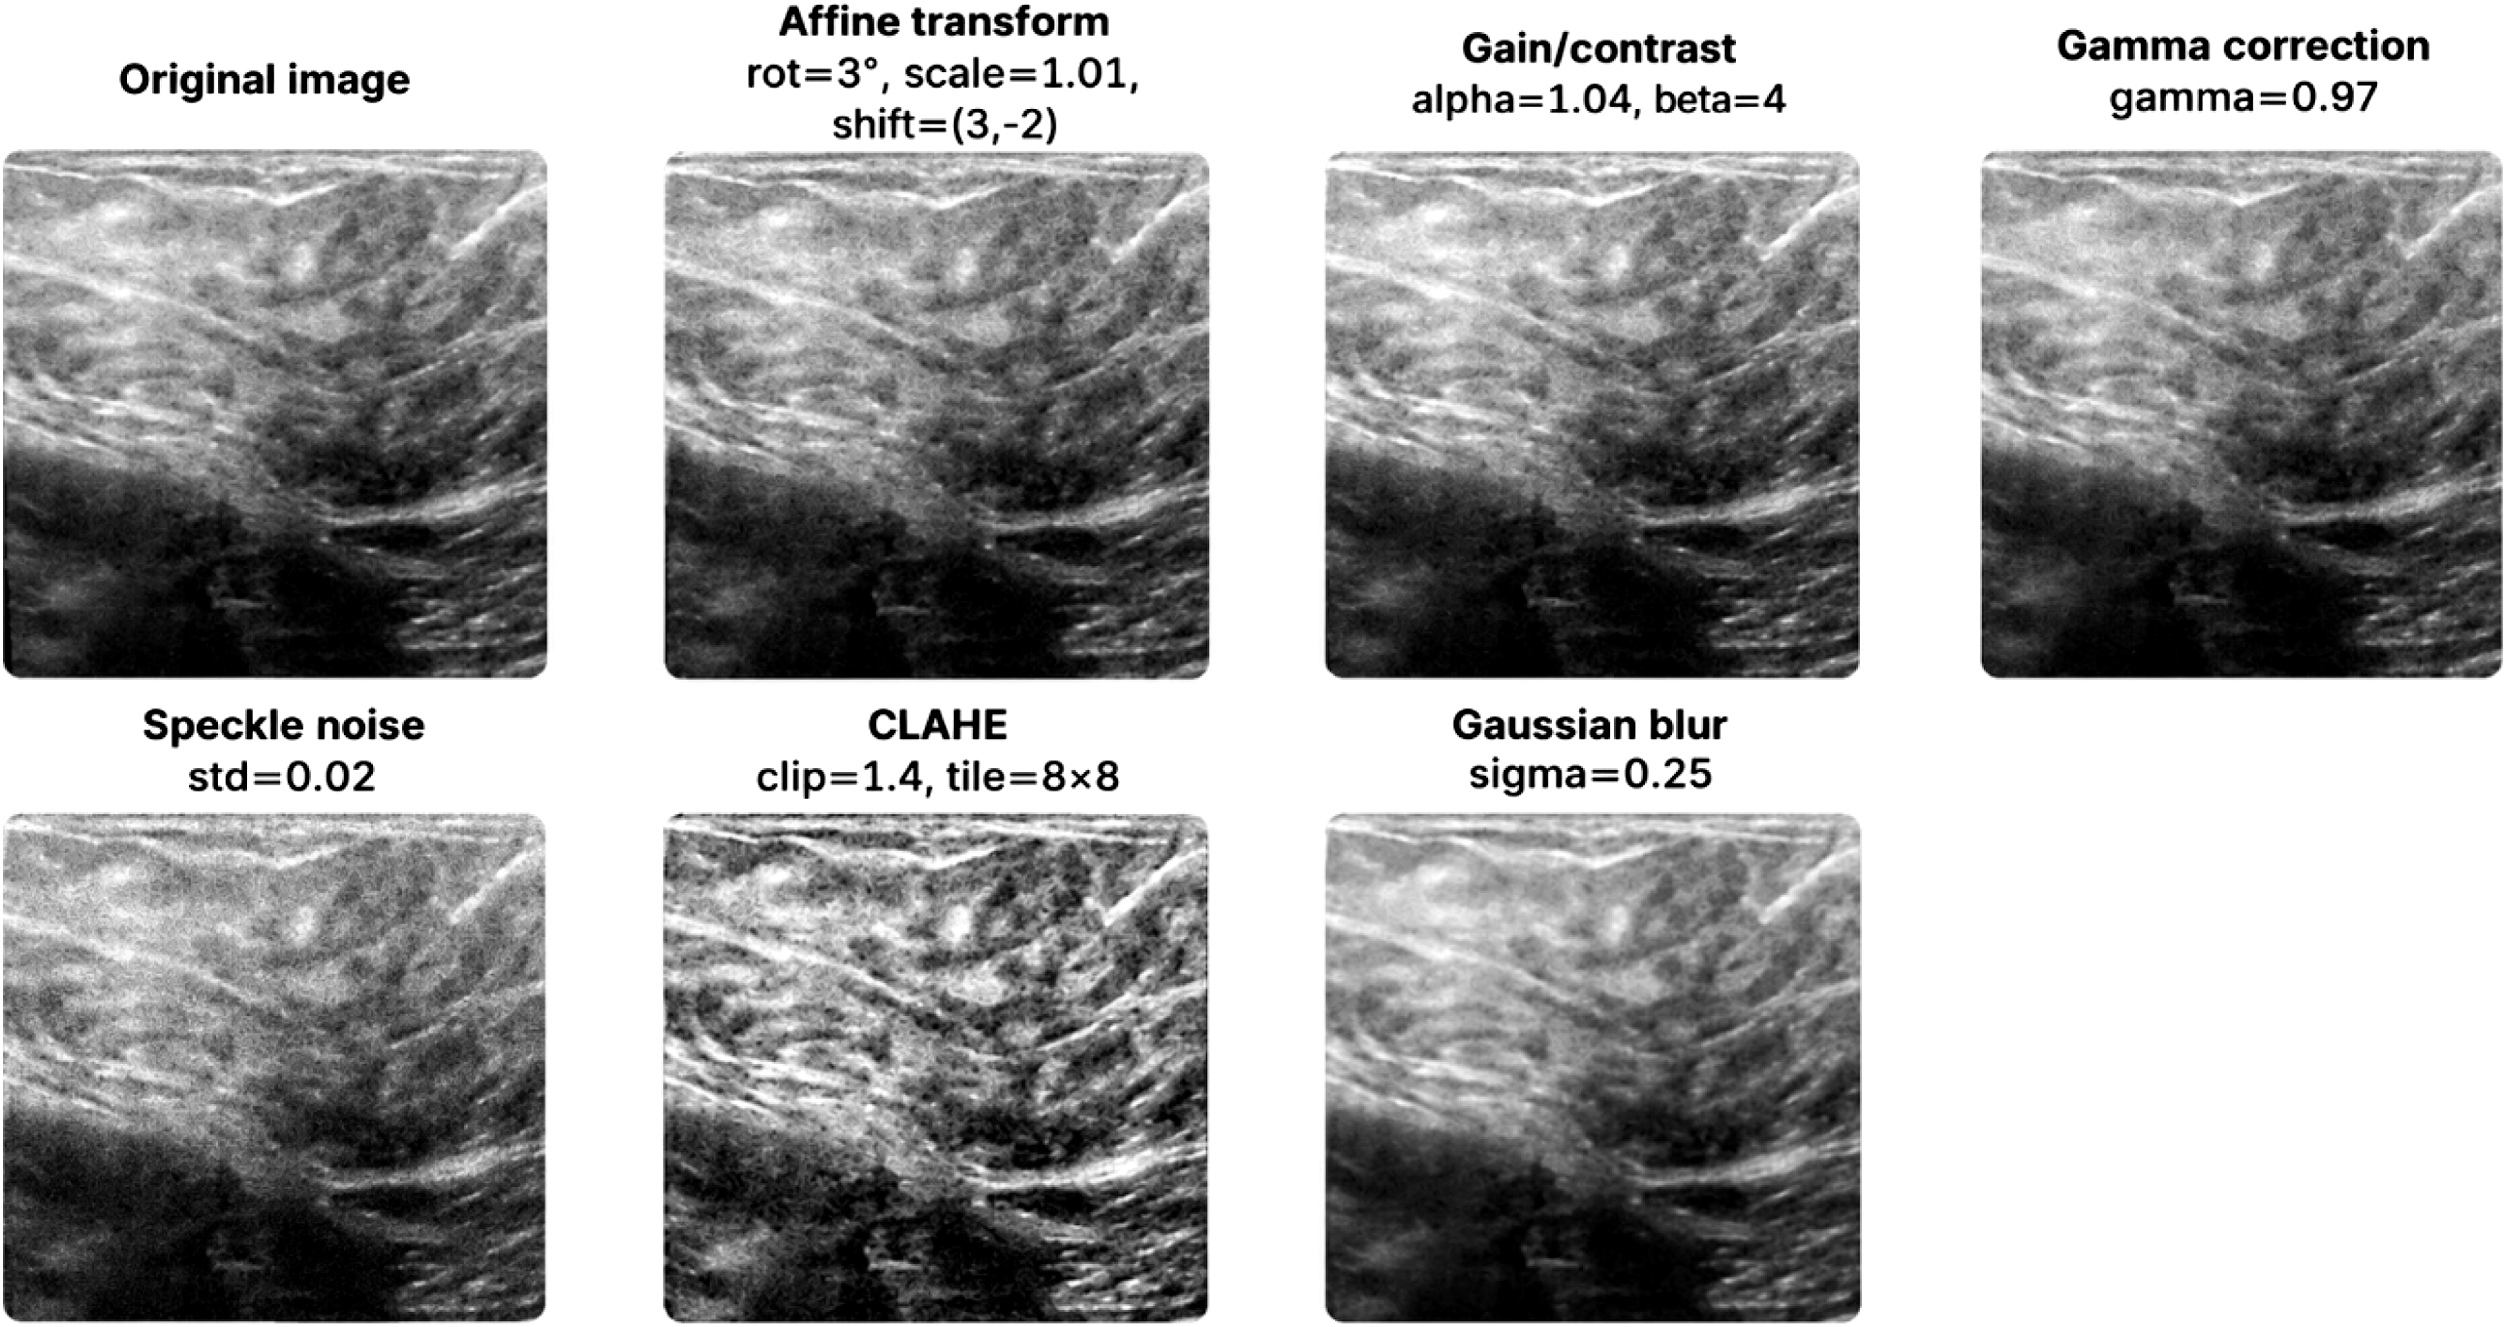 Fig. 2. Example of the proposed image augmentation process.
At inference, a test image was passed through the trained Fold-4 model, and the SoftMax output yielded class probabilities such as:
The predicted class was therefore malignant, and Grad-CAM was used to visualise the dominant high-activation region driving the decision.
H.REPRODUCIBILITY AND IMPLEMENTATION DETAILS
Framework: PyTorch
GPU: NVIDIA RTX
Input size: 224 × 224
Batch size: 16
Epochs: 20
Optimiser: AdamW
Learning rate: 1e-4
Weight decay: 1e-4
Random seed: 42
Cross-validation: 5-fold stratified
Source Code: https://github.com/arijit-parad0x/BUS_CBAM_Arijit
IV.EXPERIMENTAL RESULTS AND DISCUSSION
A.DATASET DESCRIPTION
This paper used an integrated breast ultrasound image dataset of both publicly available BUSI dataset [25] and proprietary dataset [26], which was summarised in Table I. Images labelled as benign, malignant, and normal were included in the public BUSI dataset, and the additional images were added only to the malignant and benign categories in the private dataset. The normal category in the general population data set was significantly underrepresented, and this prompted the augmentation plan embraced in this research. Even though the private dataset lacked normal-tissue images, it greatly improved the classification of malignant and benign cases. After the fusion of the public BUSI dataset and the personal one, the resulting merged dataset, which was going to be used to train and test, was as follows:
- -Normal: 800 images (there were no normal images in the private dataset, and the count of normal images was augmented to 800)
- -Benign: 1517 images (437 images in the open dataset and 1080 images in the private one)
- -Malignant: 1 033 images (210 of the public dataset and 823 of the private dataset)
| Class | Public dataset | Private dataset | Merged dataset (Final) |
|---|---|---|---|
| Normal | 133 | 0 | 800 (667 Augmented) |
| Benign | 437 | 1080 | 1517 |
| Malignant | 210 | 823 | 1033 |
B.DATA PREPROCESSING AND AUGMENTATION
Each image was resized to 224 × 224 pixels, which is the default input size in ResNet50. An 80:10:10 stratified split was used to divide the dataset into training, validation, and test sets, ensuring that the distribution of classes in each set matched the overall distribution. Normal images were scaled to 800 images through a quality-controlled augmentation pipeline to increase the size of the normal class by 133, thereby maintaining the anatomical integrity inherent to ultrasound imaging.
C.MODEL SELECTION AND EXPERIMENTAL SETUP
The architecture used in this paper was a ResNet50 with a CBAM. This was to increase the network’s ability to emphasise salient features in ultrasound images, especially in differentiating normal from malignant tissue. ResNet50 has been chosen because it uses residual connections, which make it easier to train and converge faster. To enhance channel-wise and spatial attention, CBAM was added to enable the network to focus on informative regions of the images. The model was trained using cross-entropy loss and optimised with the AdamW optimiser, which includes weight decay as a regularisation mechanism. To eliminate the huge imbalance of the normal and the benign/malignant classes, the use of class-balanced focal loss function was done. The effect of unbalanced data is reduced in this way because the weights of losses are set in proportion to the frequencies of the classes. Besides, a weighted random sampler is used during training to ensure the representation of the normal class was sufficiently balanced across every mini-batch.
To ensure the model’s robustness and avoid overfitting, a 5-fold cross-validation approach was used. For each fold:
- •The training and validation data were split into 80% and 10%, respectively.
- •The test set was held out for final evaluation.
- •Each fold model was trained and evaluated on its specific data split, ensuring that all data points were used for both training and testing.
Normal images are augmented using mild transformations, including rotation ±3°, scaling 0.98–1.02, translation ± 2%, gamma correction 0.9–1.1, gain adjustment α = 1.04 and β = 4, Gaussian blur σ = 0.25, and CLAHE with clip limit 1.4. These settings preserved ultrasound image quality while increasing normal-class diversity.
D.VARIABLES MEASURED AND ANALYTICAL TECHNIQUES
The following variables are measured in each fold and on the held-out test set:
- •Accuracy
- •Macro-Precision
- •Macro-Recall
- •Macro-F1
- •Macro-AUC (one-vs-rest)
- •Macro-Sensitivity
- •Macro-Specificity
- •Confusion matrix
For a class c, sensitivity and specificity were computed as
Macro-values were obtained by averaging across the three classes.
E.MODEL TRAINING AND VALIDATION RESULTS
In this section, we provide an overview of the training and validation results obtained across the 5-fold cross-validation. The best performance for each fold is recorded in terms of validation Macro-F1 as shown in Table II. Its graphical representation is shown in Fig. 3.
Table II. Summary of model training
| Fold | Best validation accuracy (%) | Best validation macro-F1 | Best validation AUC |
|---|---|---|---|
| 1 | 87.56 | 0.8836 | 0.9629 |
| 2 | |||
| 3 | 89.05 | 0.8994 | 0.9612 |
| 4 | 89.22 | 0.8998 | 0.965 |
| 5 | 88.06 | 0.8898 | 0.9638 |
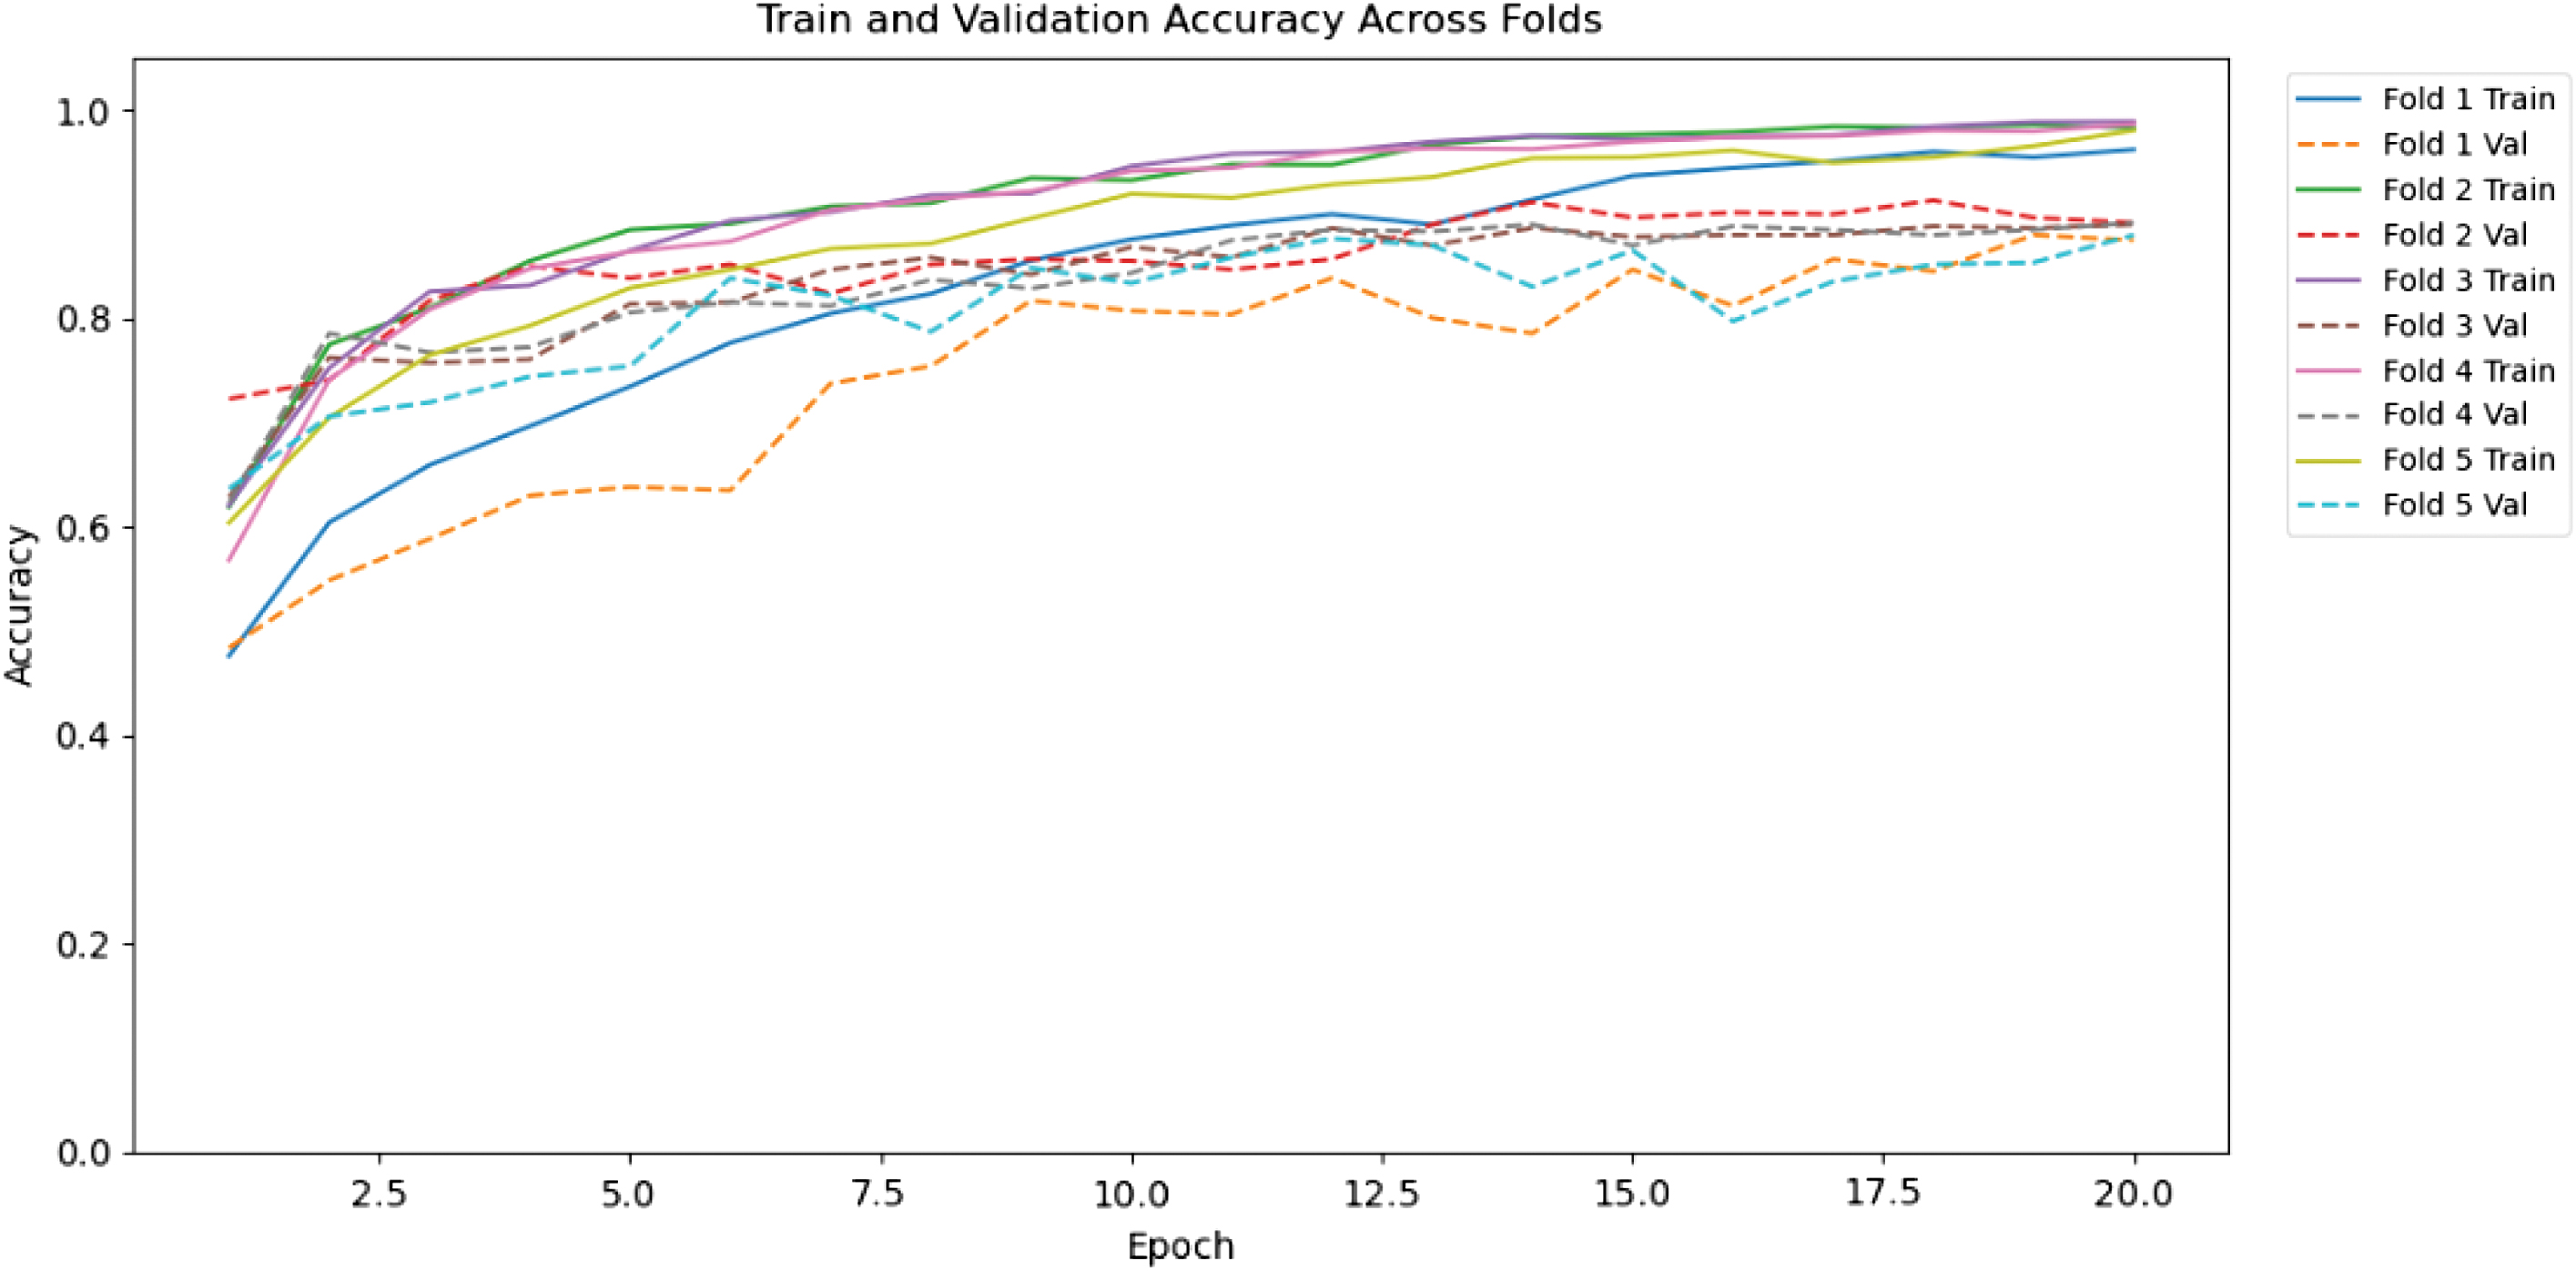 Fig. 3. Training and validation accuracy across folds.
Training accuracy on Fold 1 begins at 47.64% in the first epoch and gradually increases with successive epochs. The training accuracy at Epoch 20 is 96.27, and the training macro-F1 score rises to 0.9618, indicating strong training and adaptation to the training set. The validation accuracy started at 48.42% in Epoch 1 and increased to 87.56%, with the validation macro-F1 score increasing correspondingly from 0.4289 to 0.8836 as the epoch progressed, indicating the model’s increased ability to generalise to unseen data. The maximum validation macro-F1 of Fold 1 was 0.8886 in Epoch 20, which means high classification activity, especially with regard to the accuracy to recall between the three classes.
A similar trend is observed with Fold 2, where training accuracy began at 61.94 per cent and gradually increased to 98.09 percent by the 20th epoch. The macrolf1 score started at 0.5766 and reached its maximum of 0.9809 at the last epoch. Progress in validation accuracy of Fold 2 started with 72.31 and 88.06. The validation macro-F1 scores steadily increased, and the highest score of 0.9224 across all folds underscores the model’s strong generalisation on the validation set. The highest validation macro-F1 in Fold 2 was 0.9224, and, again, this fold was better across all folds.
The accuracy of the Fold 3 training got activated at 62.11% and reached 98.96% at epoch 20. Accordingly, the macro-f1 score was at 0.5393 at the start of training and increased to 0.9897 at the end of the last epoch, demonstrating a consistent increase in the macro-f1 score throughout training. The initial validation accuracy was 62.85% which increased to 88.89% at Epoch 20, and the validation macro-F1 increased smoothly from 0.6373 to 0.8994, suggesting good generalisation to out-of-sample data. The best macro-F1 was achieved in Fold 3: 0.8994, which is still satisfactory but not as good as in Fold 2.
With Fold 4, the training accuracy was 56.84% and rose with the number of epochs to 98.71% by Epoch 20. A good learning trajectory was seen from the macro-F1 score, which began at 0.4910 and ended at 0.9873 at the final epoch. The accuracy at the first validation was 62.35%, and at Epoch 20, it was 89.22%. Validation macro-F1 score was slowly improved from 0.6296 to 0.8998, which shows that the model has high level of generalisation. The best macro-F1 validation result obtained in Fold 4 was 0.8998, outperforming Fold 3, but not as good as Fold 2. The training accuracy with Fold 5 starts at 60.41 percent and rose to 98.09 percent at the conclusion of Epoch 20. The training macro-f1 score began at 0.5028 and peaked at 0.9809 at the last epoch, indicating steady learning. The initial validation accuracy was 63.68, and it rose to 88.06 at Epoch 20. The validation macro-F1 score rose to 0.8898, up from 0.6489, which was a good performance, though marginally lower than other folds. Best validation macro-F1-Fold 5 was 0.8898, which is lower than the best validation macro-F1-Fold 4, but it is still a good result.
F.MODEL TEST RESULTS
After performing 5-fold cross-validation, the final model’s performance was evaluated on the held-out test set. These results include several key metrics, as shown in Table III, which are discussed below.
| Fold | Accuracy (%) | Precision (%) | Recall (%) | Macro-F1 (%) | AUC (%) | Sensitivity (%) | Specificity (%) |
|---|---|---|---|---|---|---|---|
| 1 | 85.07 | 86.46 | 86.95 | 86.62 | 96.07 | 86.95 | 92.05 |
| 2 | 87.46 | 88.39 | 89.12 | 88.67 | 96.16 | 89.12 | 93.36 |
| 3 | 87.46 | 88.49 | 88.49 | 88.49 | 96.50 | 88.49 | 93.13 |
| 4 | 89.85 | 90.73 | 90.87 | 90.80 | 96.71 | 90.87 | 94.50 |
| 5 | 85.07 | 86.29 | 87.05 | 86.56 | 96.01 | 87.05 | 92.10 |
The model showed strong performance across all considered measures (Fig. 4) and all cross-validation folds, indicating good learning and generalisation. A value of 0.9629 on the receiver operating characteristic (ROC) curve (AUC), which is consistently observed across folds, is another testament to the model’s strong discriminatory power, particularly in classifying benign, malignant, and normal cases.
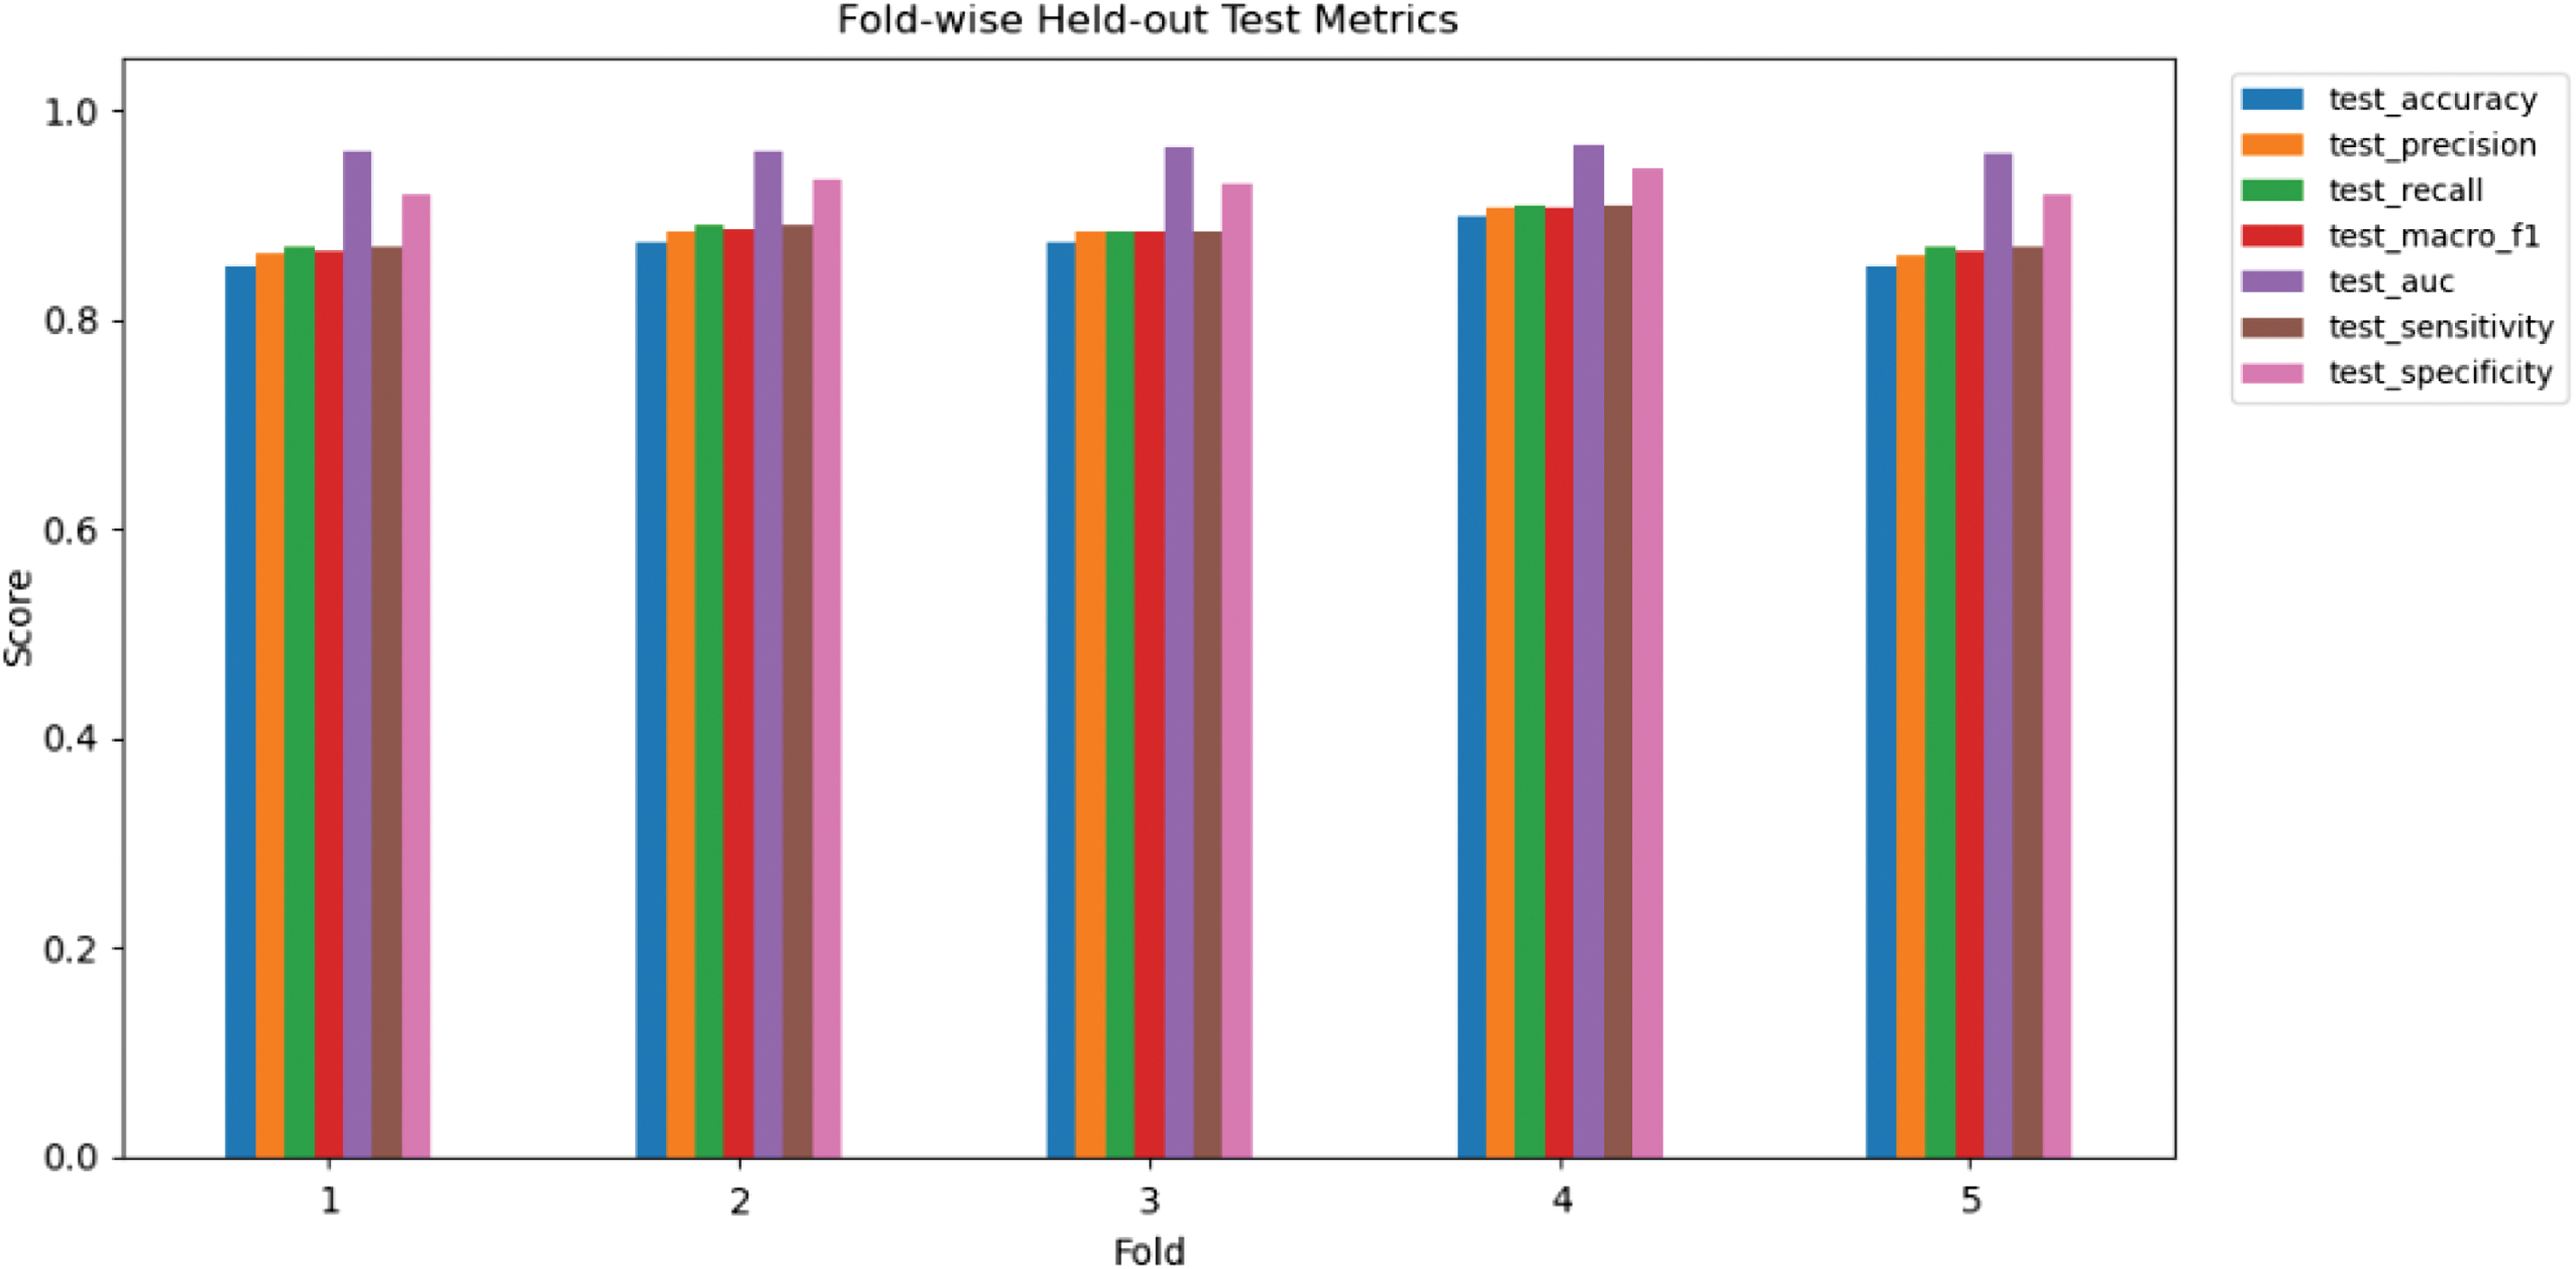 Fig. 4. Fold-wise test results.
The ROC curves of benign, malignant, and normal groups in classes are provided in Fig. 5. The AUC values for the benign and malignant classes are 0.9542 and 0.9470, respectively, indicating the model’s ability to discriminate between the two abnormal phenotypes.
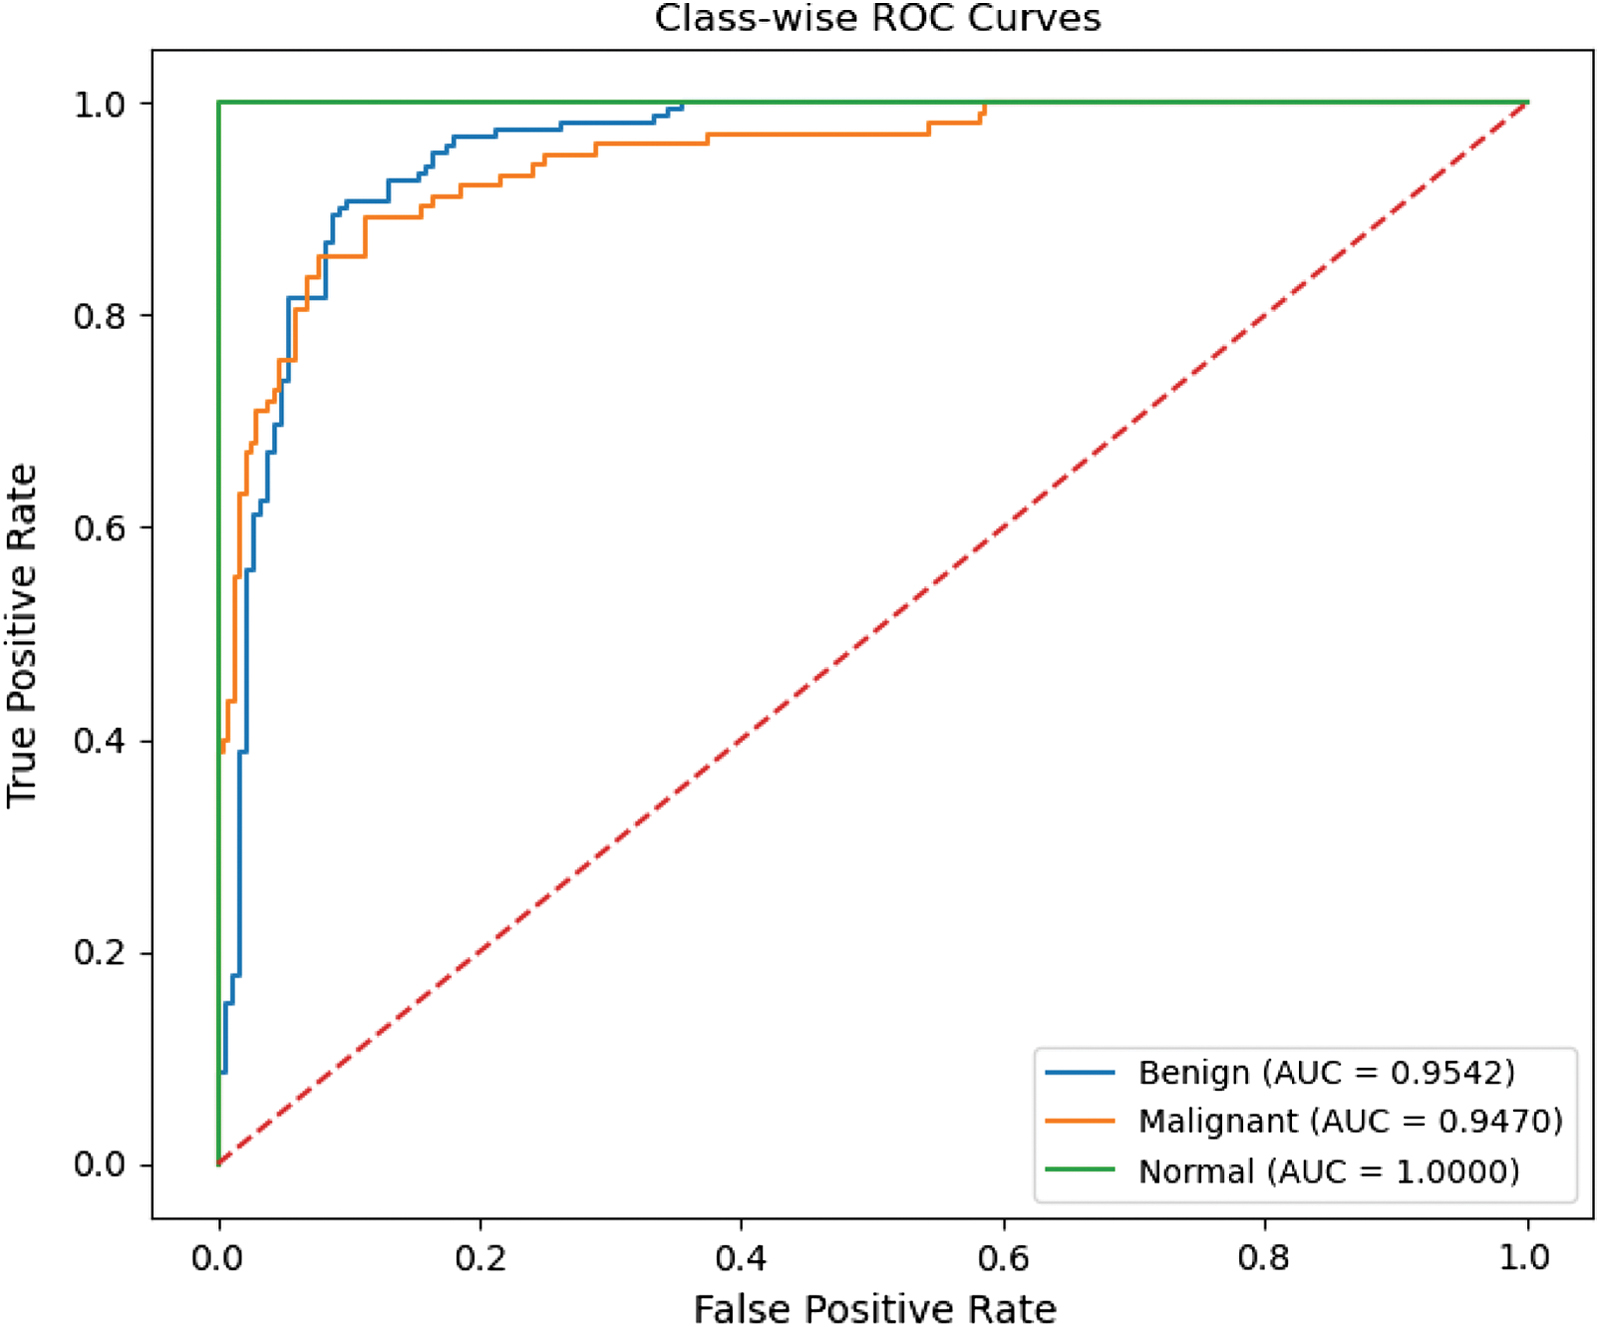 Fig. 5. Class-wise ROC curves.
Benign AUC: 0.9542
Malignant AUC: 0.9470
Normal AUC: 1.0000
Such results suggest that the model demonstrates strong discriminative capability at distinguishing between benign, malignant, and normal cases and that the normal category achieves the perfect AUC of 1.0000. This should be expected with the use of quality-regulated enhancement to the usual image collection.
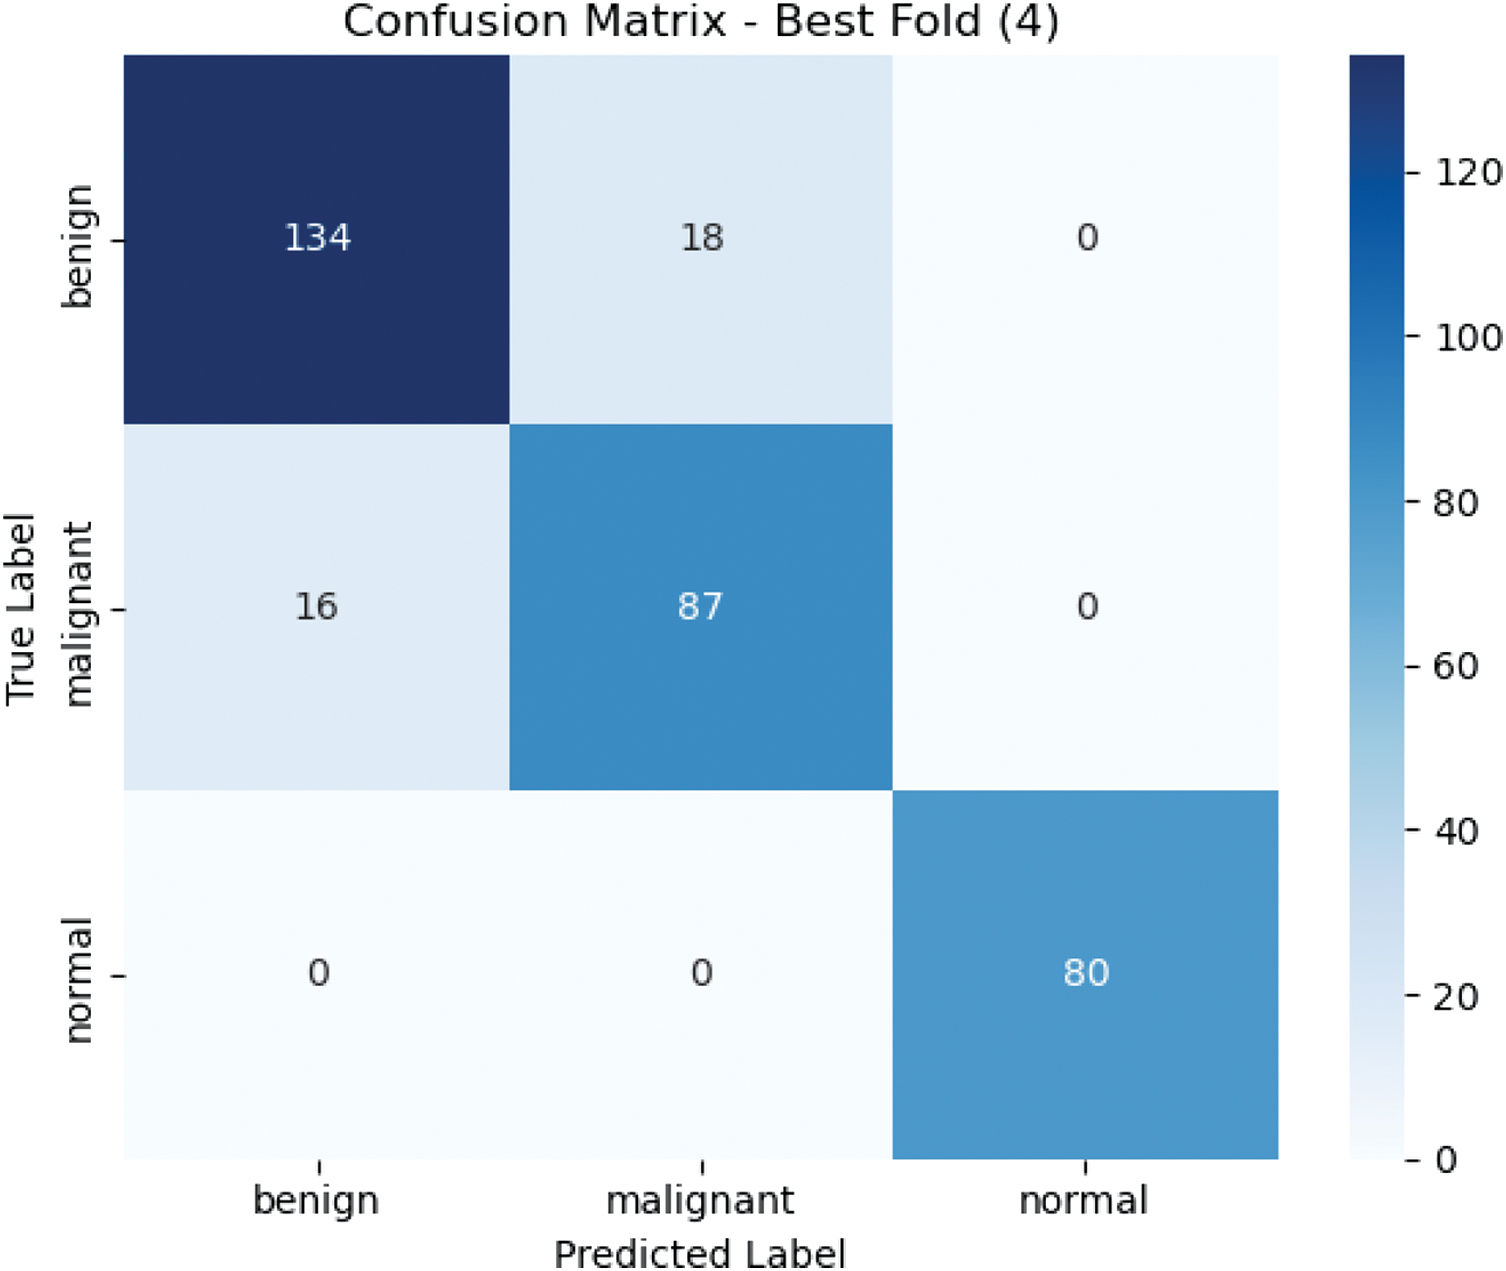
The confusion matrix in Fig. 6 represents the best cross-validation fold. The table shows how the model performs in terms of classification across the three categories, with 134 benign, 87 malignant, and 80 normal images correctly classified. Classification error was confined to 18 cases between the benign and the malignant groups, with none in the normal group, suggesting strong discriminating power of the normal tissue, which was probably due to the increased normal data.
To summarise the model’s performance across all folds, the mean ± standard deviation of the test metrics is plotted in Fig. 7. The mean scores for the metrics across all folds were very high, with AUC the most notable at 0.9629 ± 0.0027.
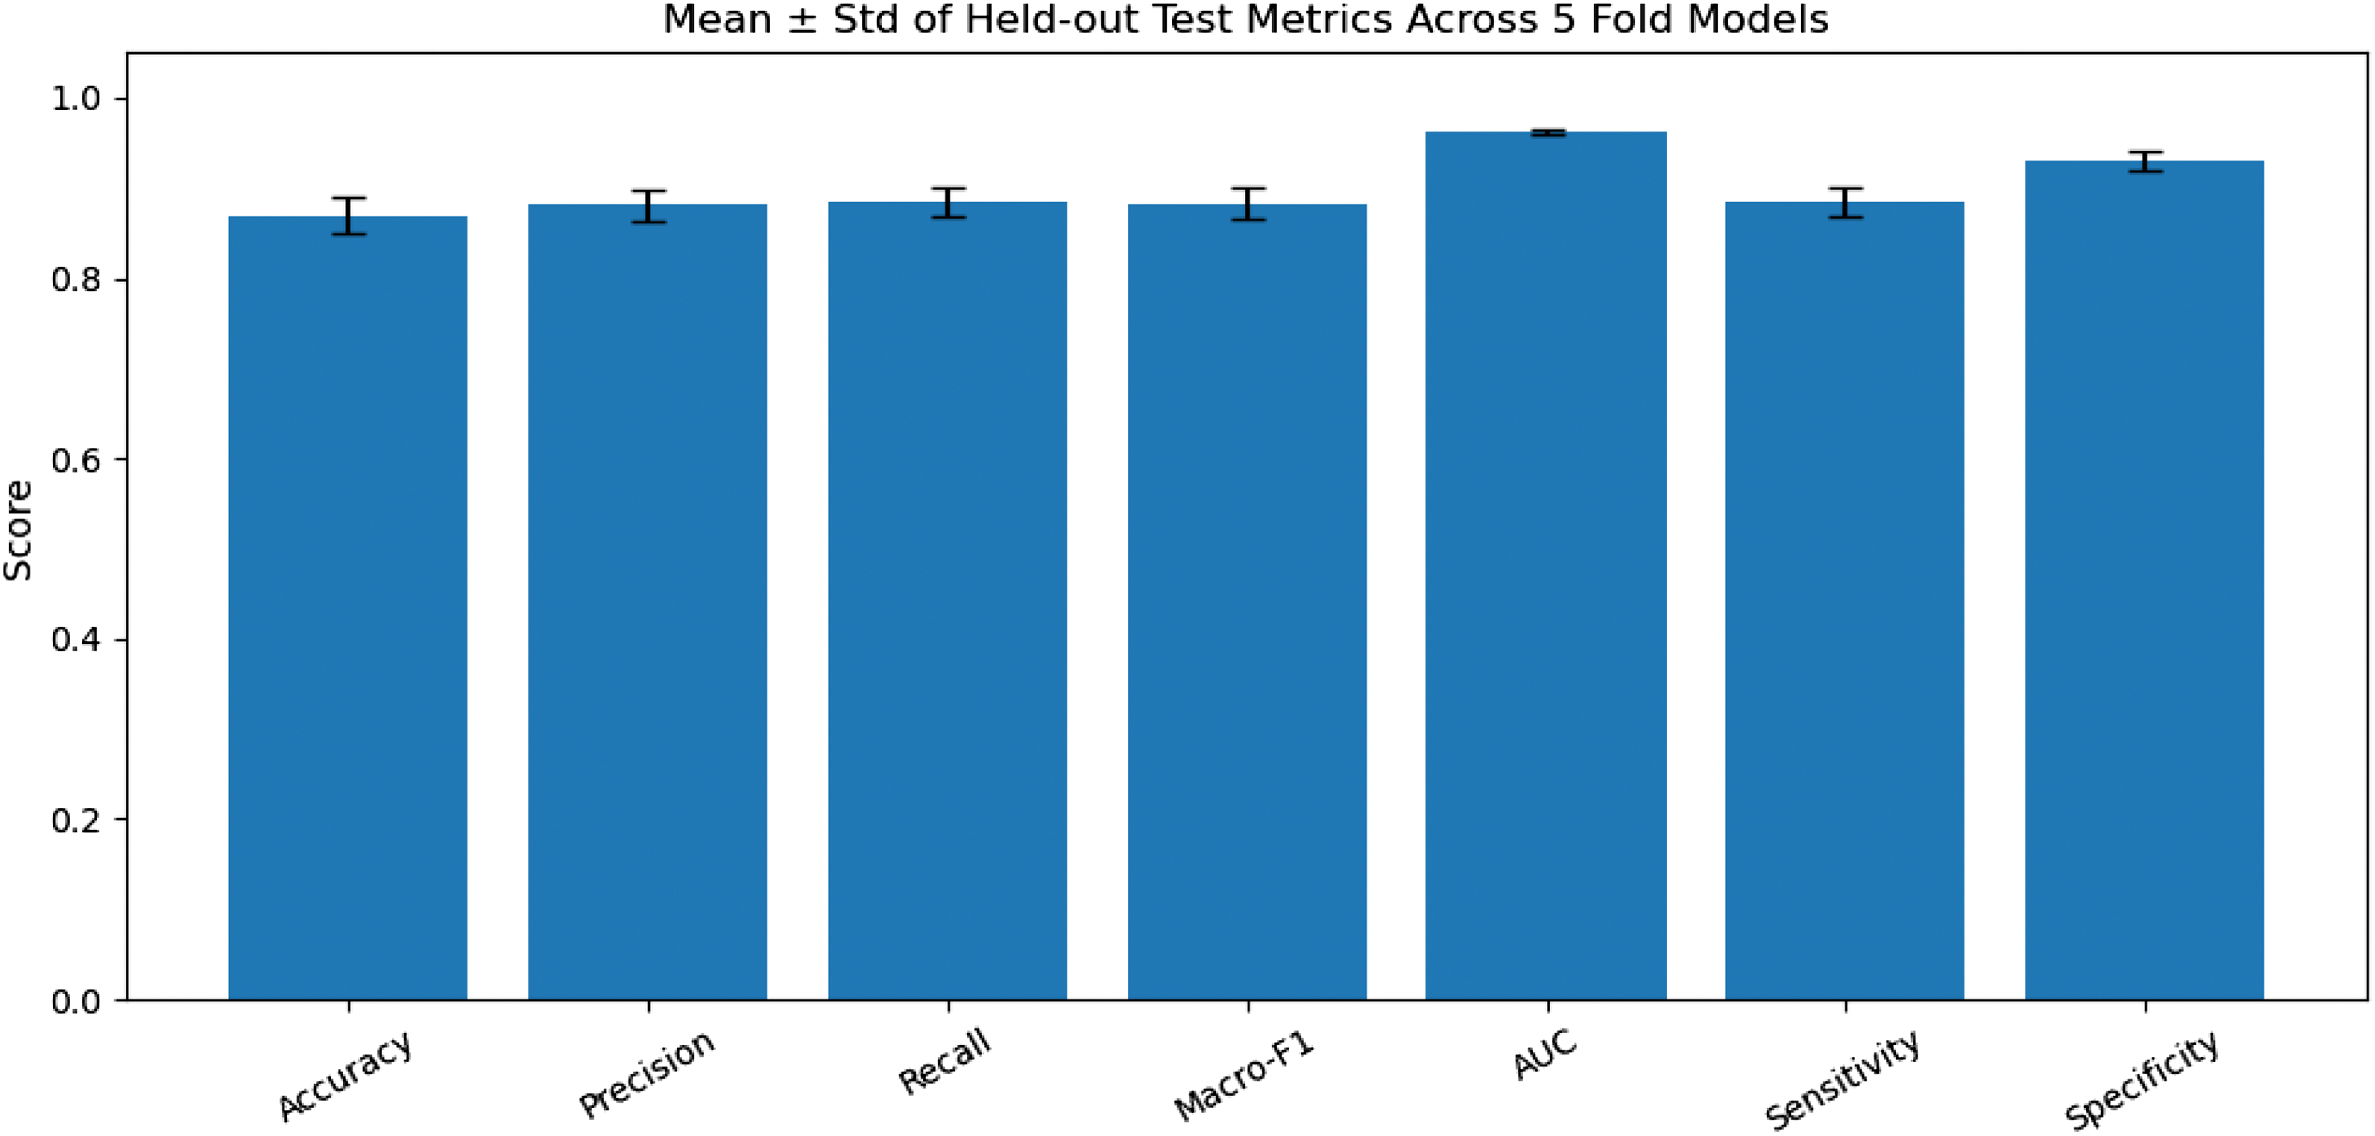 Fig. 7. Mean +- Std of held-out test metrics.
On the whole, the study shows that the given methodology is effective in addressing class imbalance by applying quality-controlled augmentation to the normal class, thereby increasing classification efficacy. The model achieved high performance indicators in all cross-validation folds, with the best fold achieving a validation Macro-F1 of 0.9224 and a test accuracy of 89.22%. The strong distinction between normal cases and benign and malignant cases also supports the effectiveness of the augmentation strategy and indicates that it could be used in a clinical environment on a translational basis.
G.EXPLAINABILITY WITH GRAD-CAM VISUALISATIONS
Here we explain the Grad-CAM visualisations produced for each class: benign, malignant, and normal. These visualisations provide a clear explanation of the areas within the ultrasound images that the model examined when making its classification, which is imperative to establishing that model predictions are precise and clinically interpretable.
The flask-based web graphical user interface (GUI) shown in Fig. 8 will enable users to post breast ultrasound images and obtain predicted classifications and confidence scores for benign, malignant, and normal. This interface is coupled with Grad-CAM visualisation to give end-users an explanation of the decision-making process of the model. Each prediction also shows an uploaded image, a Grad-CAM heatmap, and a Grad-CAM overlay, providing the clinician and researchers with visual insight into how the model arrived at its prediction, thereby improving transparency and building confidence in the AI system’s prediction.
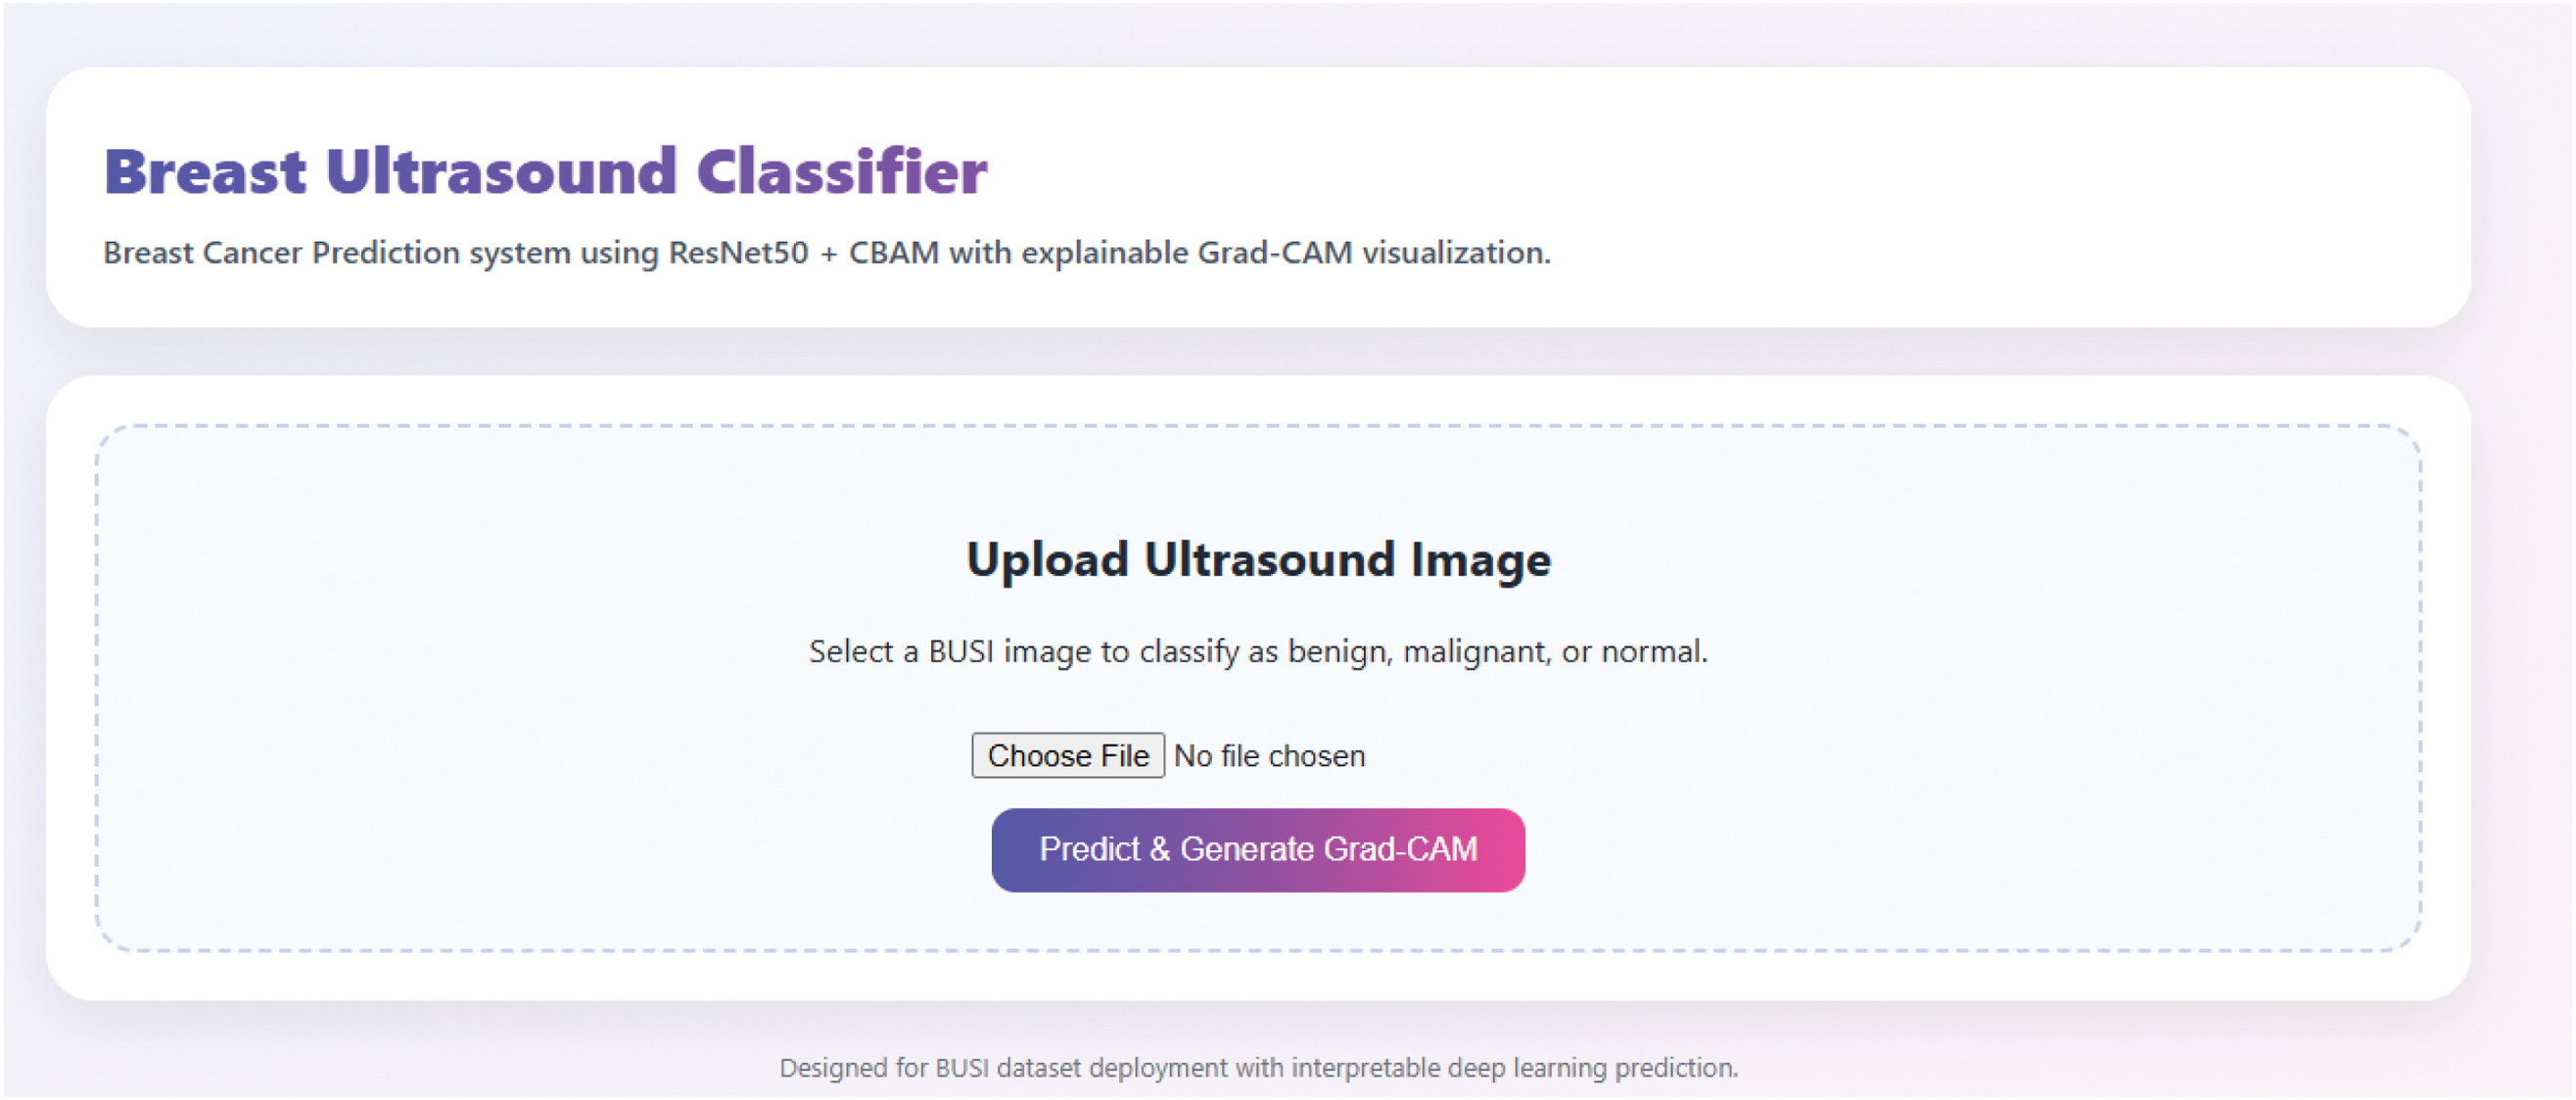 Fig. 8. Web graphical user interface.
The Grad-CAM heatmap for the benign class (Fig. 9) shows the regions the model paid more attention to when making the classification decision. The heatmap (left image) in this case shows that the model focused on the edges of the lesion. This is further determined by the Grad-CAM overlay (right image), which colours the area of interest in red and yellow, indicating the regions most significant to the prediction. The model’s 93.43% specificity in predicting the benign class further demonstrates that it is interested in clinically significant image features.
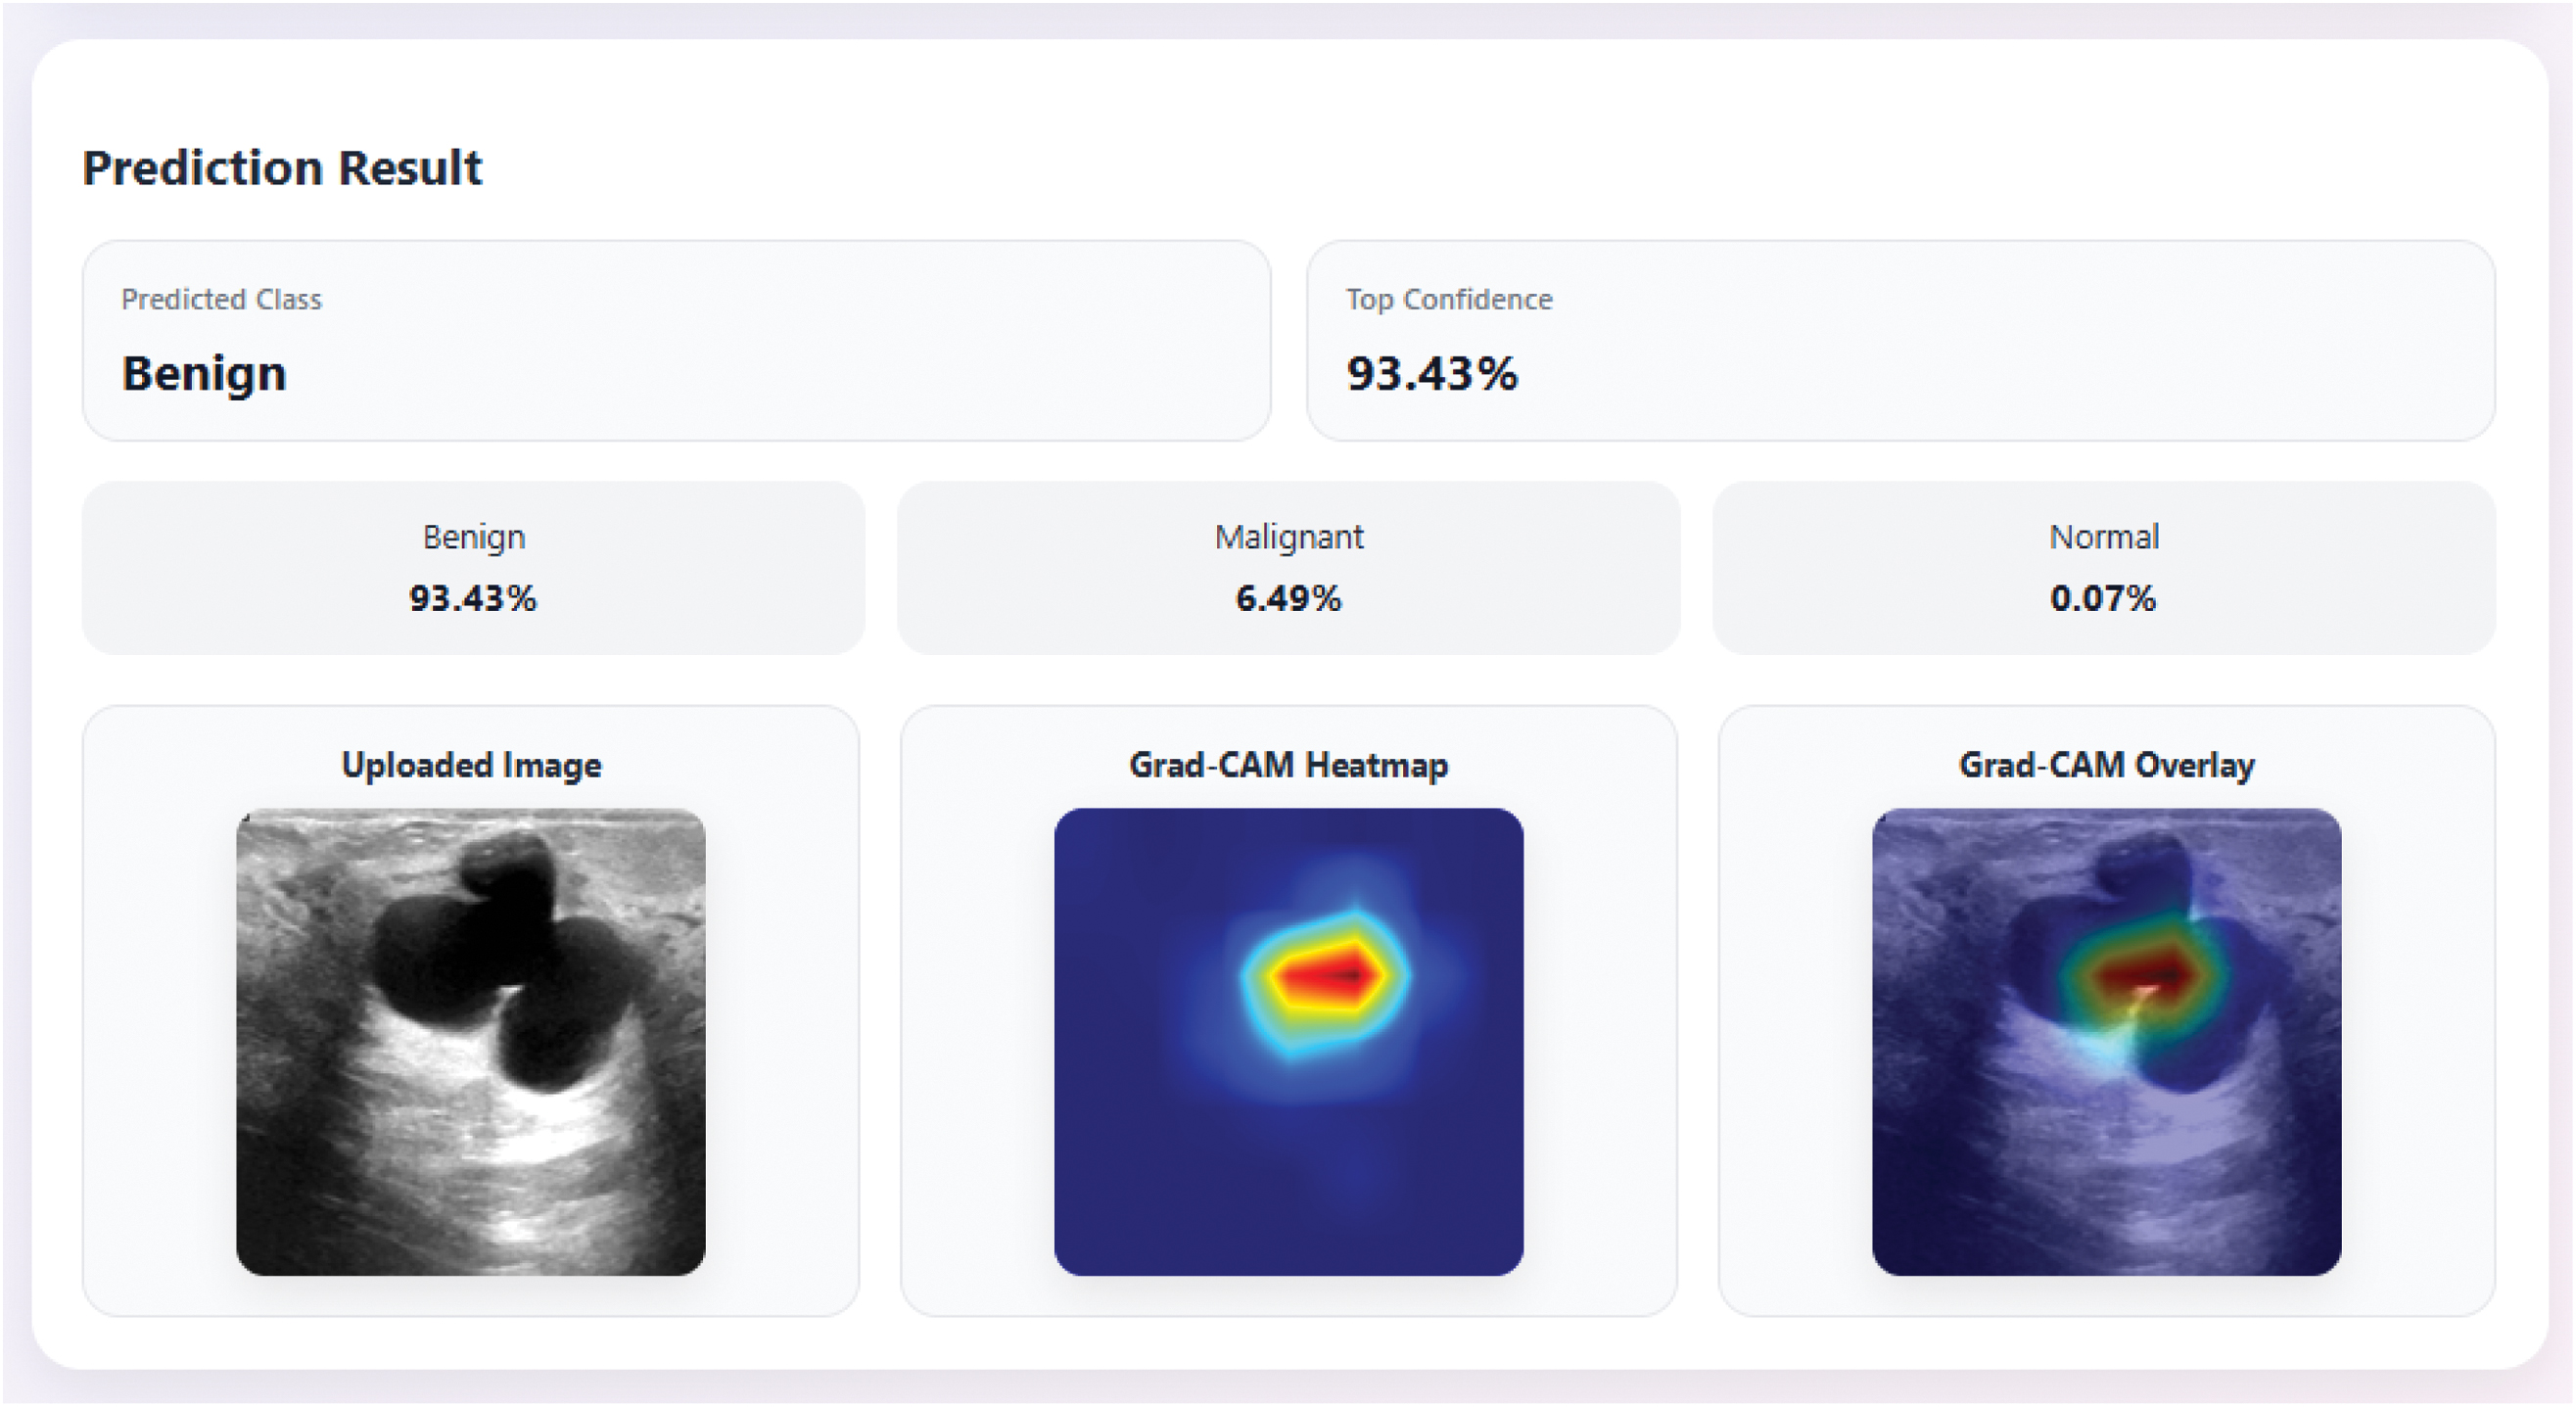 Fig. 9. Grad-CAM heatmap for the benign class.
The Grad-CAM heatmap for the malignant class (Fig. 10) shows the model focusing on the centre of the lesion, which is often an indication of malignancy. The heatmap (i.e., left) shows that the model identified the most significant characteristic of the malignant lesion, whereas the Grad-CAM overlay (i.e., right), using red and yellow colours, emphasises the most significant parts. Since the model has the highest confidence of 98.73, the accuracy of this instance is credible given that the model concentrates on the features of the malignant tissue, which depicts a strong ability of the system to identify malignant lesions.
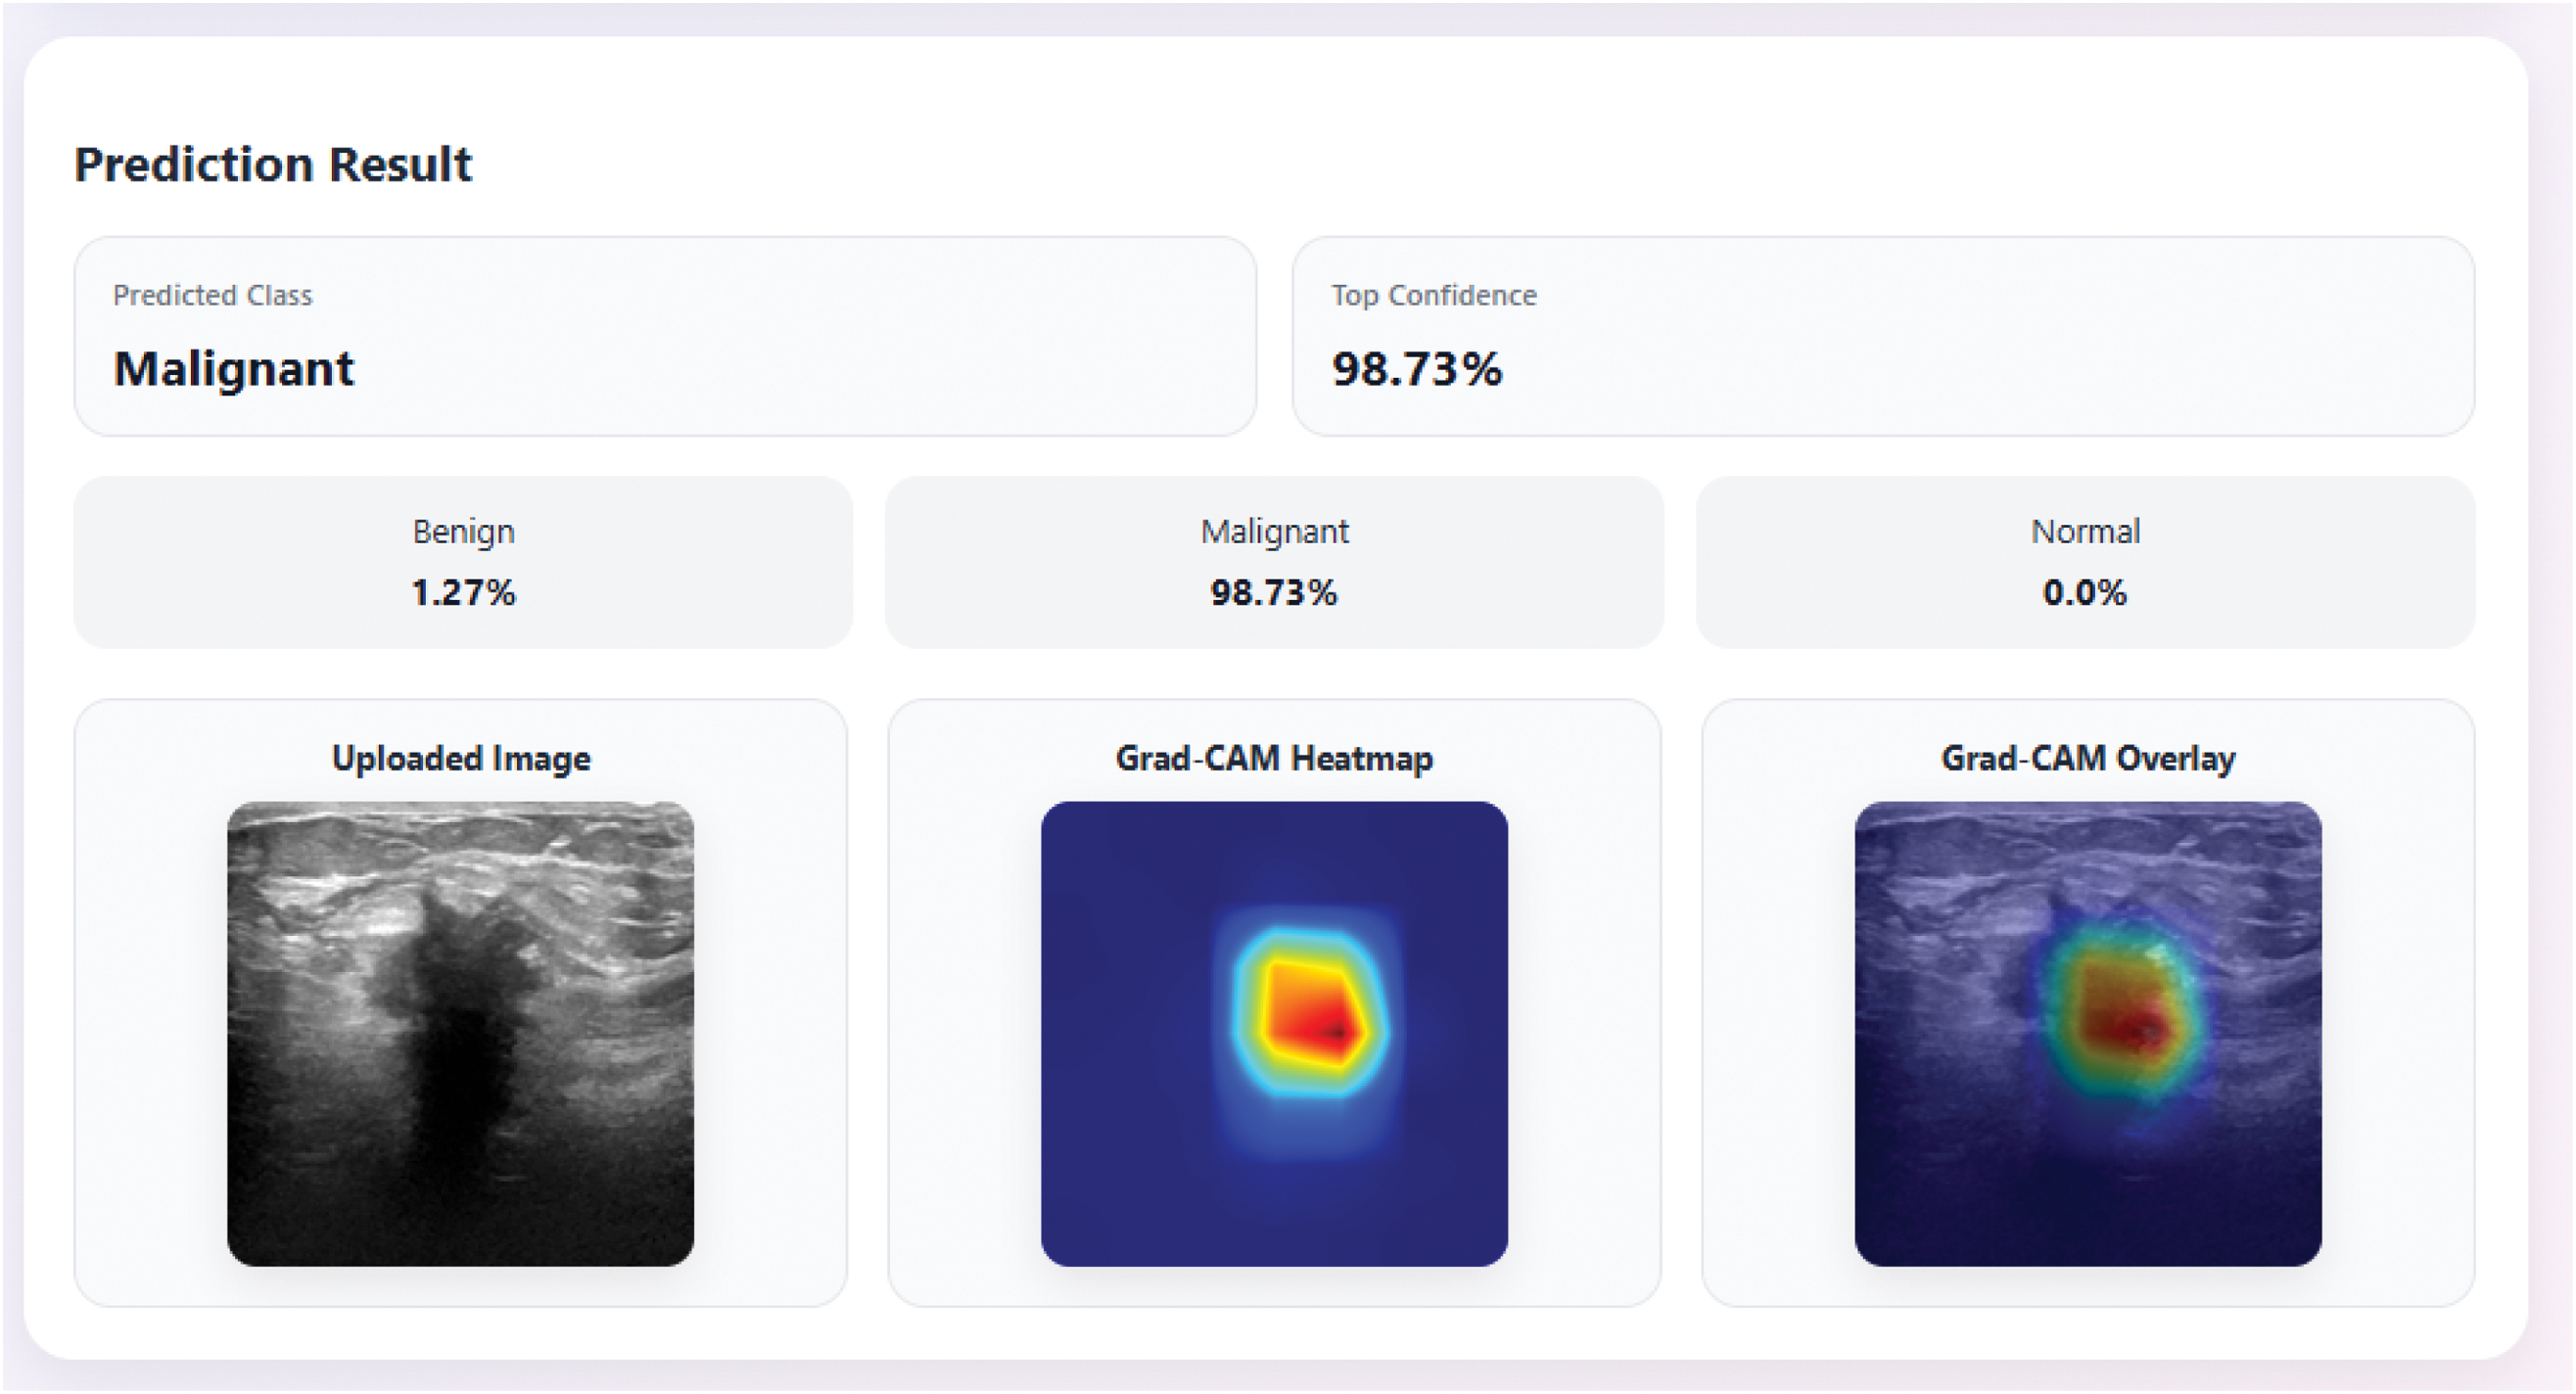 Fig. 10. Grad-CAM heatmap for the malignant class.
The Grad-CAM heatmap of the normal class (Fig. 11) indicates that the model has learnt to identify the no-presence of lesions in the ultrasound image. The heatmap (left) shows areas where the model recognises normal tissue, and the Grad-CAM overlay (right) supports this by colouring the areas with blue and green, which means that they are not important. Although this is the least confident class with a prediction confidence of 91.61%, the Grad-CAM visualisation shows that the model is capable of recognising normal tissue and the dangerous lesions or benign and malignant, a result that supports the strength of normal-class identification.
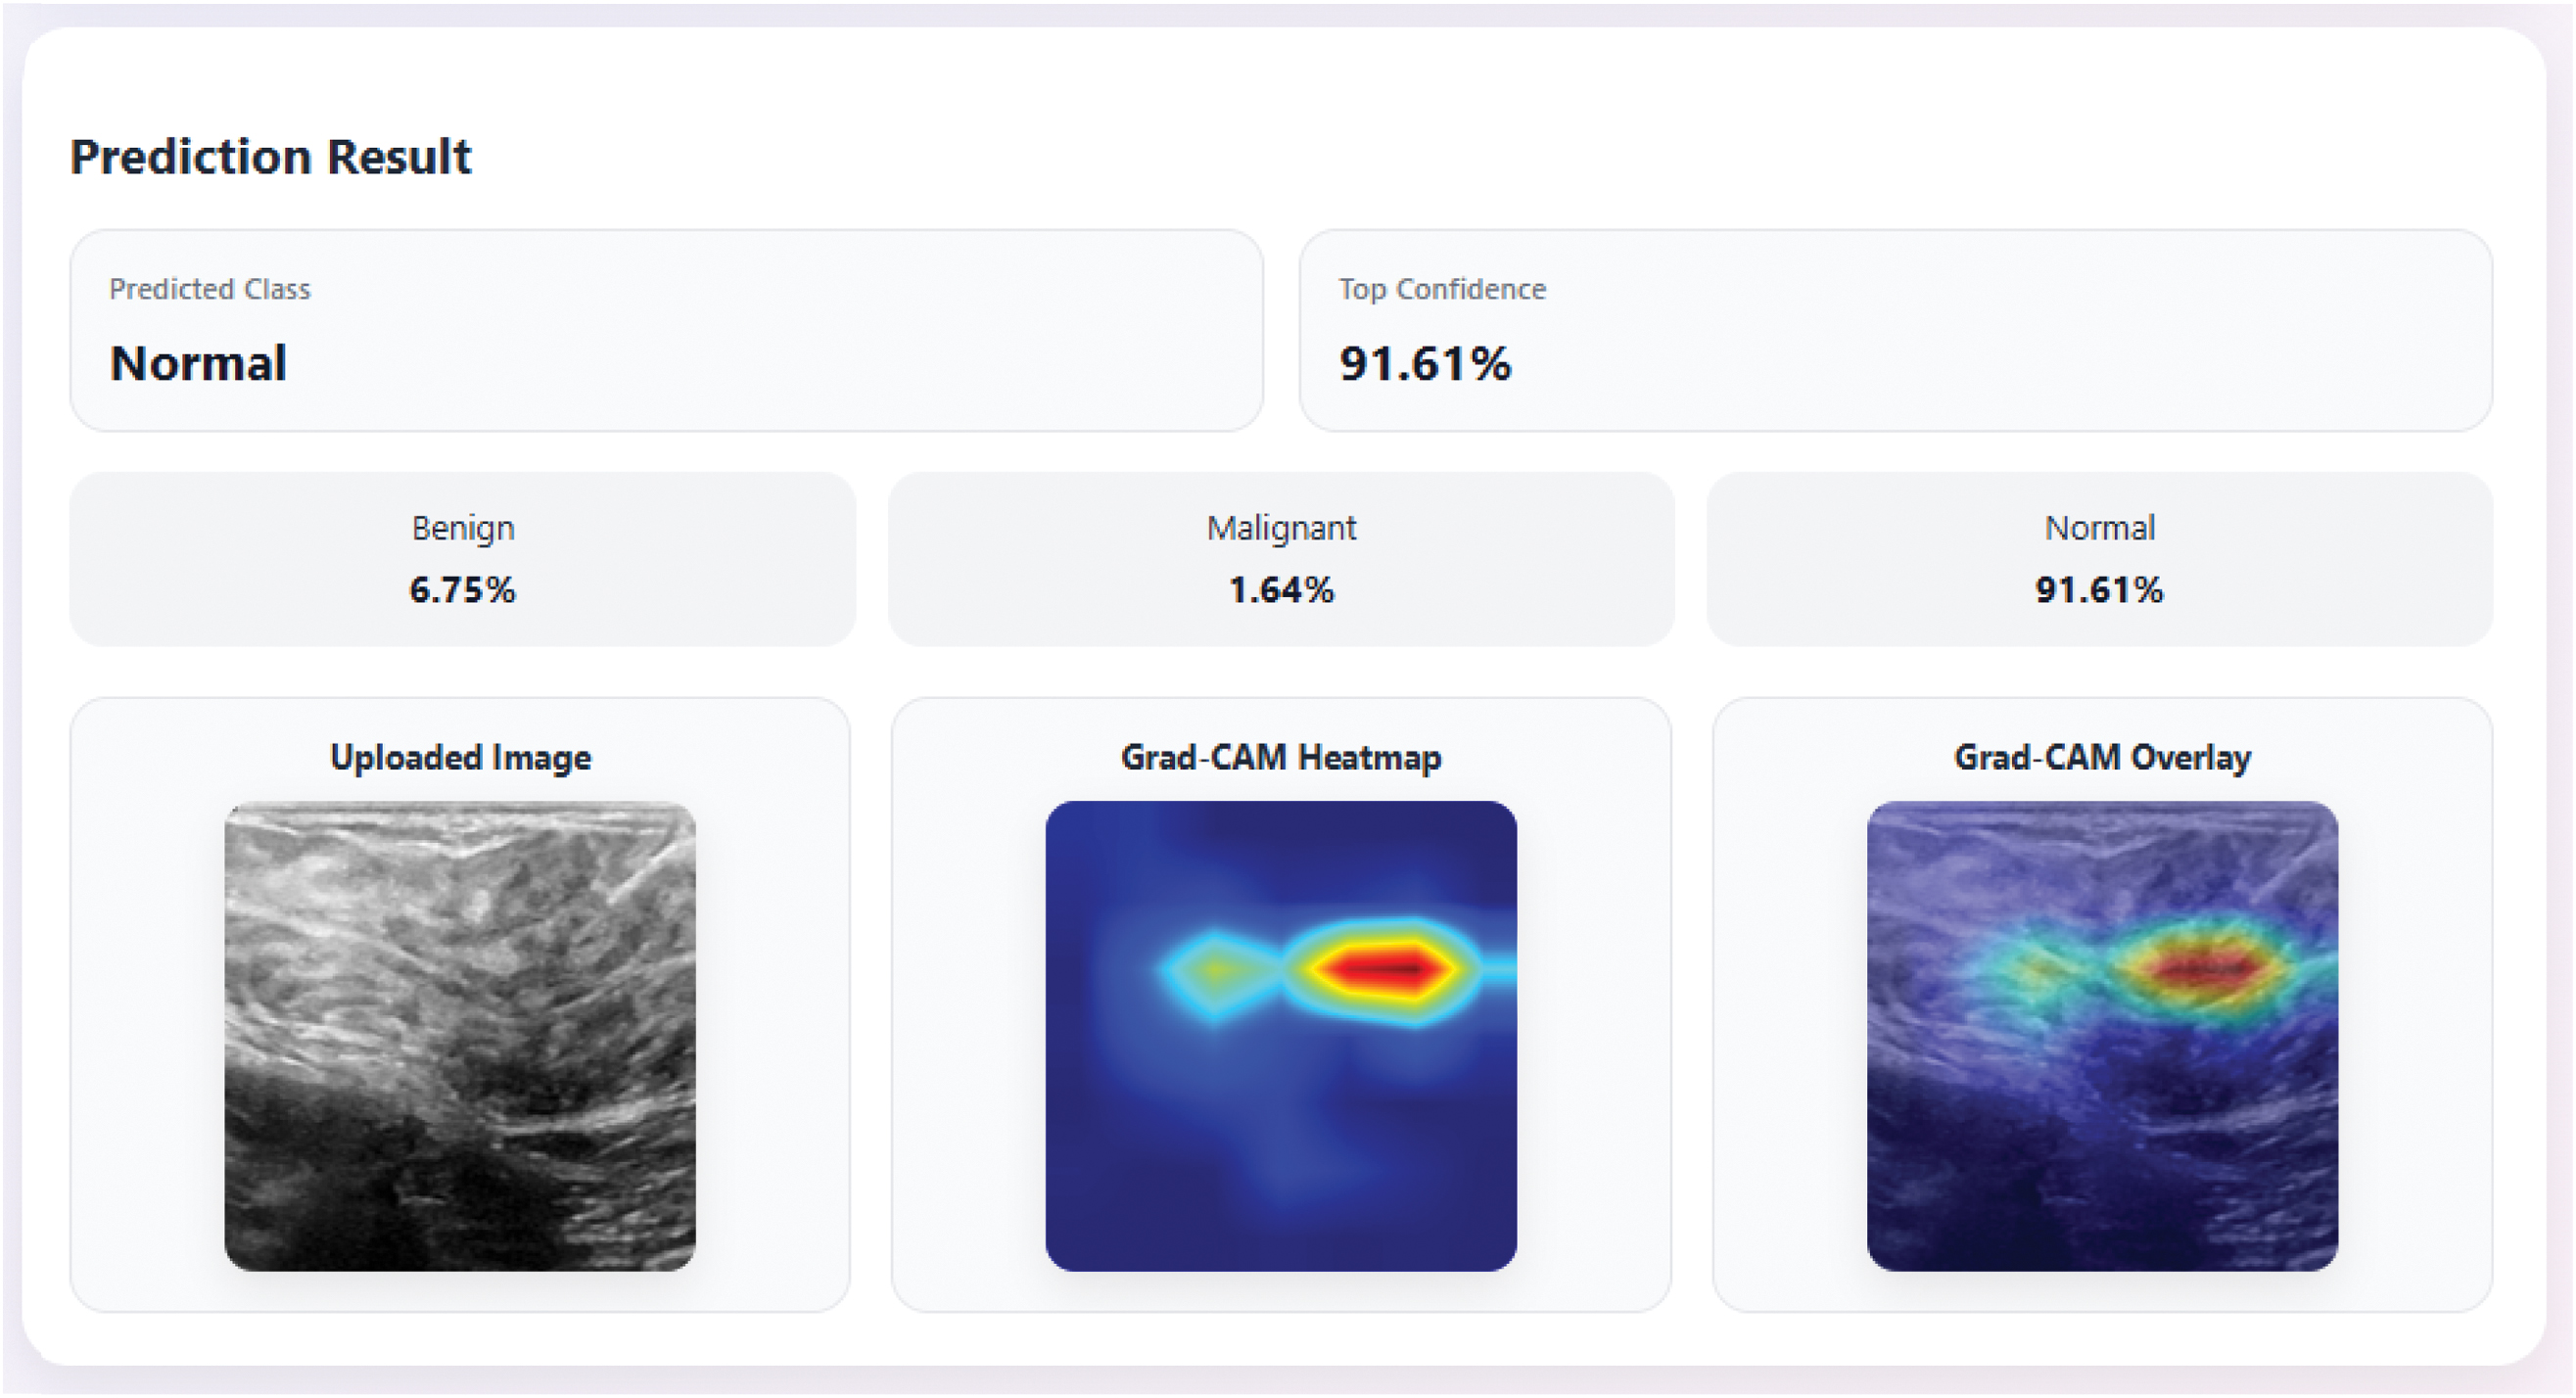
H.ABLATION STUDY
In this ablation experiment, we evaluated the effects of selectively enhancing the normal category on the model. In particular, we compared the performance of the ResNet50-CBAM model on the original, non-augmented data set, on the augmented data set, and on the normal class augmented to 800 samples.
As shown in Fig. 12 and Table IV above, augmentation resulted in significant changes across all metrics. The model’s accuracy improved by 25.95 points, from 61.04 to 86.99. The improvements in precision and recall were also significant, with precision increasing by 21.19 and recall increasing by 12.76. Macro-F1 score rose by 0.2313, indicating a substantial improvement in the model’s ability to balance performance across all classes.
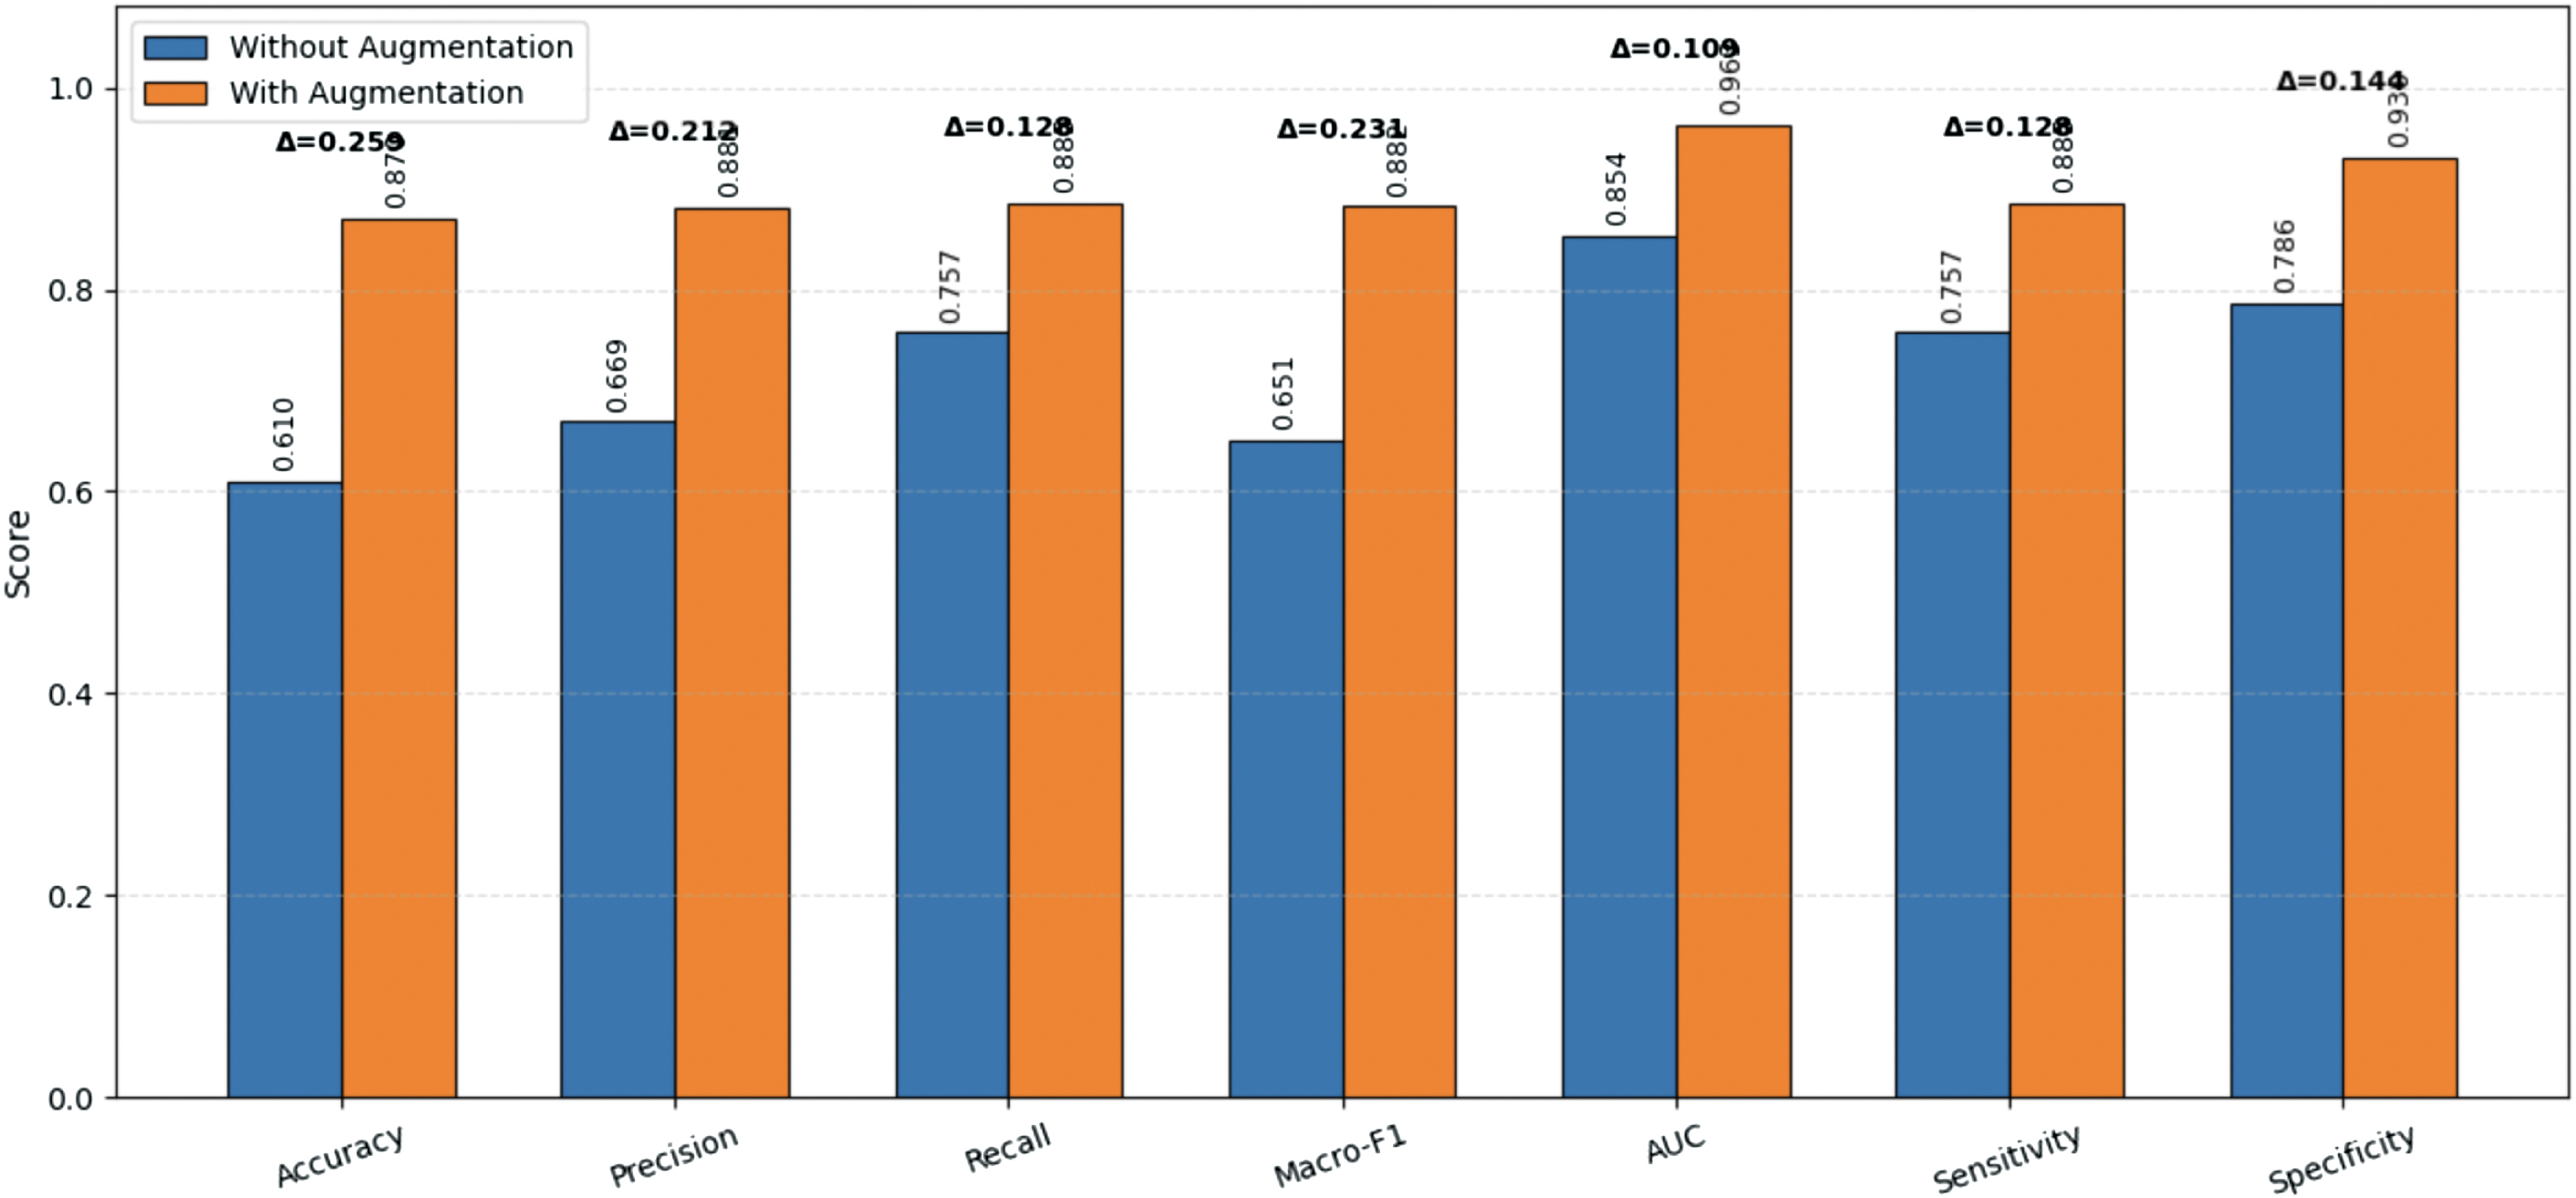 Fig. 12. Performance of the ResNet50-CBAM model using the original, non-augmented dataset and the augmented dataset.
Table IV. Performance comparison without augmentation and with controlled augmentation
| Metric | Without augmentation (%) | With augmentation (Proposed) (%) | Improvement (%) |
|---|---|---|---|
| Accuracy | 61.04 | 86.99 | 25.95 |
| Precision | 66.88 | 88.07 | 21.19 |
| Recall | 75.74 | 88.50 | 12.76 |
| Macro-F1 | 65.10 | 88.23 | 23.13 |
| AUC | 85.37 | 96.29 | 10.92 |
| Sensitivity | 75.74 | 88.50 | 12.76 |
| Specificity | 78.58 | 93.03 | 14.45 |
The AUC, an important measure of discriminatory strength, increased by 0.1092 (0.8537 to 0.9629), indicating that the augmented normal class significantly improved the model’s ability to distinguish between benign, malignant, and normal images. Both sensitivity and specificity also improved, with T scores of 0.1276 and 0.1445, respectively, highlighting a better ability to correctly identify both abnormal and normal classes.
The sensitivity and specificity scores improved by 0.1276 and 0.1445, respectively, highlighting the model’s improved ability to correctly identify both abnormal and normal classes.
This ablation study emphasises that the enhancement of the rare normal class played a vital role in enhancing the generalisation and performance of models, especially in making a distinction between normal tissue and the more prevalent benign and malignant lesions.
Although the proposed augmentation strategy improves the normal-class representation, excessive augmentation may introduce synthetic image patterns that do not perfectly reflect real-world clinical variability. To mitigate this risk, only mild ultrasound-consistent transformations are employed, and all generated samples were subjected to quality-control filtering using Laplacian variance and histogram correlation constraints. Nevertheless, external validation on independent multi-centre datasets remains necessary to fully assess model generalisability.
I.COMPARISON WITH EXISTING APPROACHES
The augmented ResNet+CBAM design is more effective than a series of state-of-the-art methods in breast ultrasound classification, as demonstrated in Table V. The proposed model has an accuracy of 86.99%, displaying 88.07% precision and 88.5% recall, compared to the Adaptive Attention U-Net (2022) with an accuracy of 82-% displaying 88.07% precision and 88.5-recall, which is the advantage of having targeted augmentation of the normal class and the use of CBAM to pay more attention to salient features. Although a ViT + Ensemble (2025) achieves strong accuracy of 88.46, the current model holds its own in the competition, with a macro-F1 score of 88.23, an area under the ROC curve of 96.29, and a specificity of 93.03, offering a better compromise between recall and precision. The CNN + Ensemble (2023) achieves 90 percent accuracy, but the present approach has better recall and precision, especially for the normal. In general, the addition of class-specific augmentation and attention systems results in a model that has superior generalisation, particularly in normal tissue distinction, and outperforms the previous methods that failed to explore the issue of class imbalance.
Table V. Comparison with SOTA methods
| Reference | Methods/Model | Accuracy | Precision | Recall | F1-Score | Specificity | AUC |
|---|---|---|---|---|---|---|---|
| 2022 [ | Adaptive Attention U-Net | 82 | 79 | 81 | 77 | 97 | |
| 2022 [ | ViT-B/32 | 82 | |||||
| 2022 [ | AlexNet | 79.5 | 80.1 | 79.6 | |||
| VGG16 | 85.4 | 85.8 | 85.5 | ||||
| VGG19 | 78.6 | 79.7 | 78.6 | ||||
| GoogleNet | 75.6 | 77.2 | 75.9 | ||||
| ResNet18 | 82.6 | 83.5 | 82.8 | ||||
| ResNet34 | 83.8 | 85.4 | 83.4 | ||||
| 2023 [ | Inception V3 | 83 | 84.5 | 83.5 | 83.5 | ||
| DenseNet121 | 84 | 84.5 | 84 | 84 | |||
| 2023 [ | VGG19 + Denoising | 80 | 67.8 | 76.8 | 71.4 | 81.6 | 84.79 |
| VGG19 + Denoising, | 82 | 69 | 85.2 | 75.8 | 80.4 | 90.7 | |
| 2023[ | CNN + Ensemble | 90 | 94 | 95 | 90 | ||
| 2023 [ | Inception V3 | 81 | 83 | 77 | 80 | 81 | |
| 2023 [ | U-Net + ResNet | 81.9 | |||||
| 2024[ | Hybrid Learning | 87.6 | 91.1 | ||||
| 2024[ | ResNet50 + Protonet | 88.2 | |||||
| 2024 [ | ViT | 92.1 | |||||
| 2025[ | VIT + Ensemble | 88.46 | 86.36 | 92.2 | 90.55 | 97 | |
| 2025 [ | nnU-Net | 84.8 | |||||
| U-Net++ | 85.8 | ||||||
| Proposed | Augmented + ResNet +CBAM | 86.99 | 88.07 | 88.5 | 88.23 | 93.03 | 96.29 |
V.CONCLUSION
This study presented a new approach to three-class breast ultrasound classification, consisting of a backbone ResNet50 with a CBAM, and applied specific augmentation to the normal group. The underlying issue of class disparity, namely the lack of normal tissue, was alleviated by adding more normal tissue images, increasing from 133 to 800 using a rigorously quality-controlled augmentation protocol. This addition played a critical role in enhancing the model’s ability to distinguish normal tissue from benign and malignant lesions.
Another highlight of this work was the combination of a proprietary private dataset with the BUSI publicly available dataset. The shared database, though useful, had a limited number of normal images and a small number of examples from the benign and malignant classes. The personal dataset added more benign and malignant images to the model, thereby improving its generalisation ability. The associated combined data helped in a more holistic training protocol and enhancement of performance in all classes, which was effective in reducing the imbalance in classes and providing more precise discrimination between benign, malignant, and normal tissues.
The test accuracy of the augmented ResNet50CBAM model was 86.99%, with precision (88.07%), recall (88.5%), and a remarkable AUC of 96.29%. The results supported the efficacy of the suggested augmentation approach and attention mechanism that, jointly, boost the performance of classification and offer valuable explainability via Grad-CAM visualisations.
VI.LIMITATIONS AND FUTURE WORK
Even though the model showed good results in performance, fold variability and poor recall of the malignant group suggested that there was room to improve. Future research must include more diverse data collections to generalise better, examine dynamic augmentation approaches that adapt to specific class demands, and optimise the model architecture, possibly using ensemble methods, to mitigate observed recall anomalies.
Overall, the paper contributed to the current body of research on automated breast ultrasound analysis by addressing class imbalance and enhancing model interpretability, which are essential for trustworthy, transparent clinical decision support systems. Both public and private datasets were integrated, which had significantly increased the ability to handle infrequent class imbalance and made the model more effective across various real-world clinical imaging conditions.